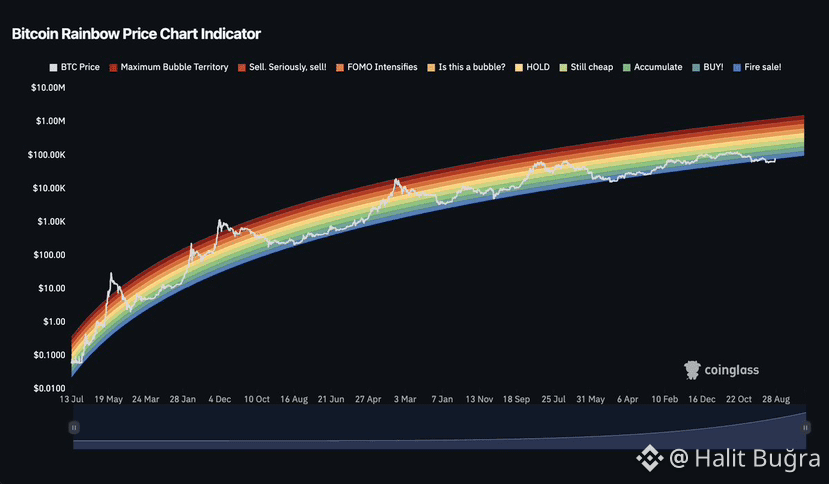
$BTC JUST RECLAIMED THE RAINBOW CHART — AND THE BIGGER PICTURE IS STARTING TO LOOK VERY INTERESTING.
Bitcoin has pushed back into the Rainbow Chart’s long-term valuation bands, putting BTC back inside a historical framework that tracks its price through different market-cycle zones.
The important part isn’t simply that Bitcoin crossed a colorful line.
The Rainbow Chart is built around a logarithmic growth model, so traders often use it as a broad cycle reference rather than a short-term trading indicator. Moving higher through these bands can signal that Bitcoin is progressing into a stronger phase of its long-term cycle.
What makes this especially interesting is what could happen if momentum continues.
If BTC holds its position and starts climbing through the higher valuation bands, market attention could shift rapidly from consolidation toward price discovery and cycle expansion.
But there’s an important catch.
The Rainbow Chart is not a prediction machine. Bitcoin has deviated from historical models before, and macro conditions, liquidity, institutional flows, regulation, and overall risk appetite can completely change how a cycle develops.
So reclaiming the chart alone doesn’t guarantee a massive rally.
Still, seeing Bitcoin regain this long-term structure is something worth watching closely.
If BTC keeps moving through the Rainbow bands instead of falling back below them, the next stage of this cycle could become much more interesting.
The real question now:
Is Bitcoin simply returning to its historical trend…
or preparing for the next major expansion?
Bitcoin has pushed back into the Rainbow Chart’s long-term valuation bands, putting BTC back inside a historical framework that tracks its price through different market-cycle zones.
The important part isn’t simply that Bitcoin crossed a colorful line.
The Rainbow Chart is built around a logarithmic growth model, so traders often use it as a broad cycle reference rather than a short-term trading indicator. Moving higher through these bands can signal that Bitcoin is progressing into a stronger phase of its long-term cycle.
What makes this especially interesting is what could happen if momentum continues.
If BTC holds its position and starts climbing through the higher valuation bands, market attention could shift rapidly from consolidation toward price discovery and cycle expansion.
But there’s an important catch.
The Rainbow Chart is not a prediction machine. Bitcoin has deviated from historical models before, and macro conditions, liquidity, institutional flows, regulation, and overall risk appetite can completely change how a cycle develops.
So reclaiming the chart alone doesn’t guarantee a massive rally.
Still, seeing Bitcoin regain this long-term structure is something worth watching closely.
If BTC keeps moving through the Rainbow bands instead of falling back below them, the next stage of this cycle could become much more interesting.
The real question now:
Is Bitcoin simply returning to its historical trend…
or preparing for the next major expansion?