🚨 $TAC IS MOVING FAST — +44.93% AND THE CHART IS GETTING HOT! 🔥
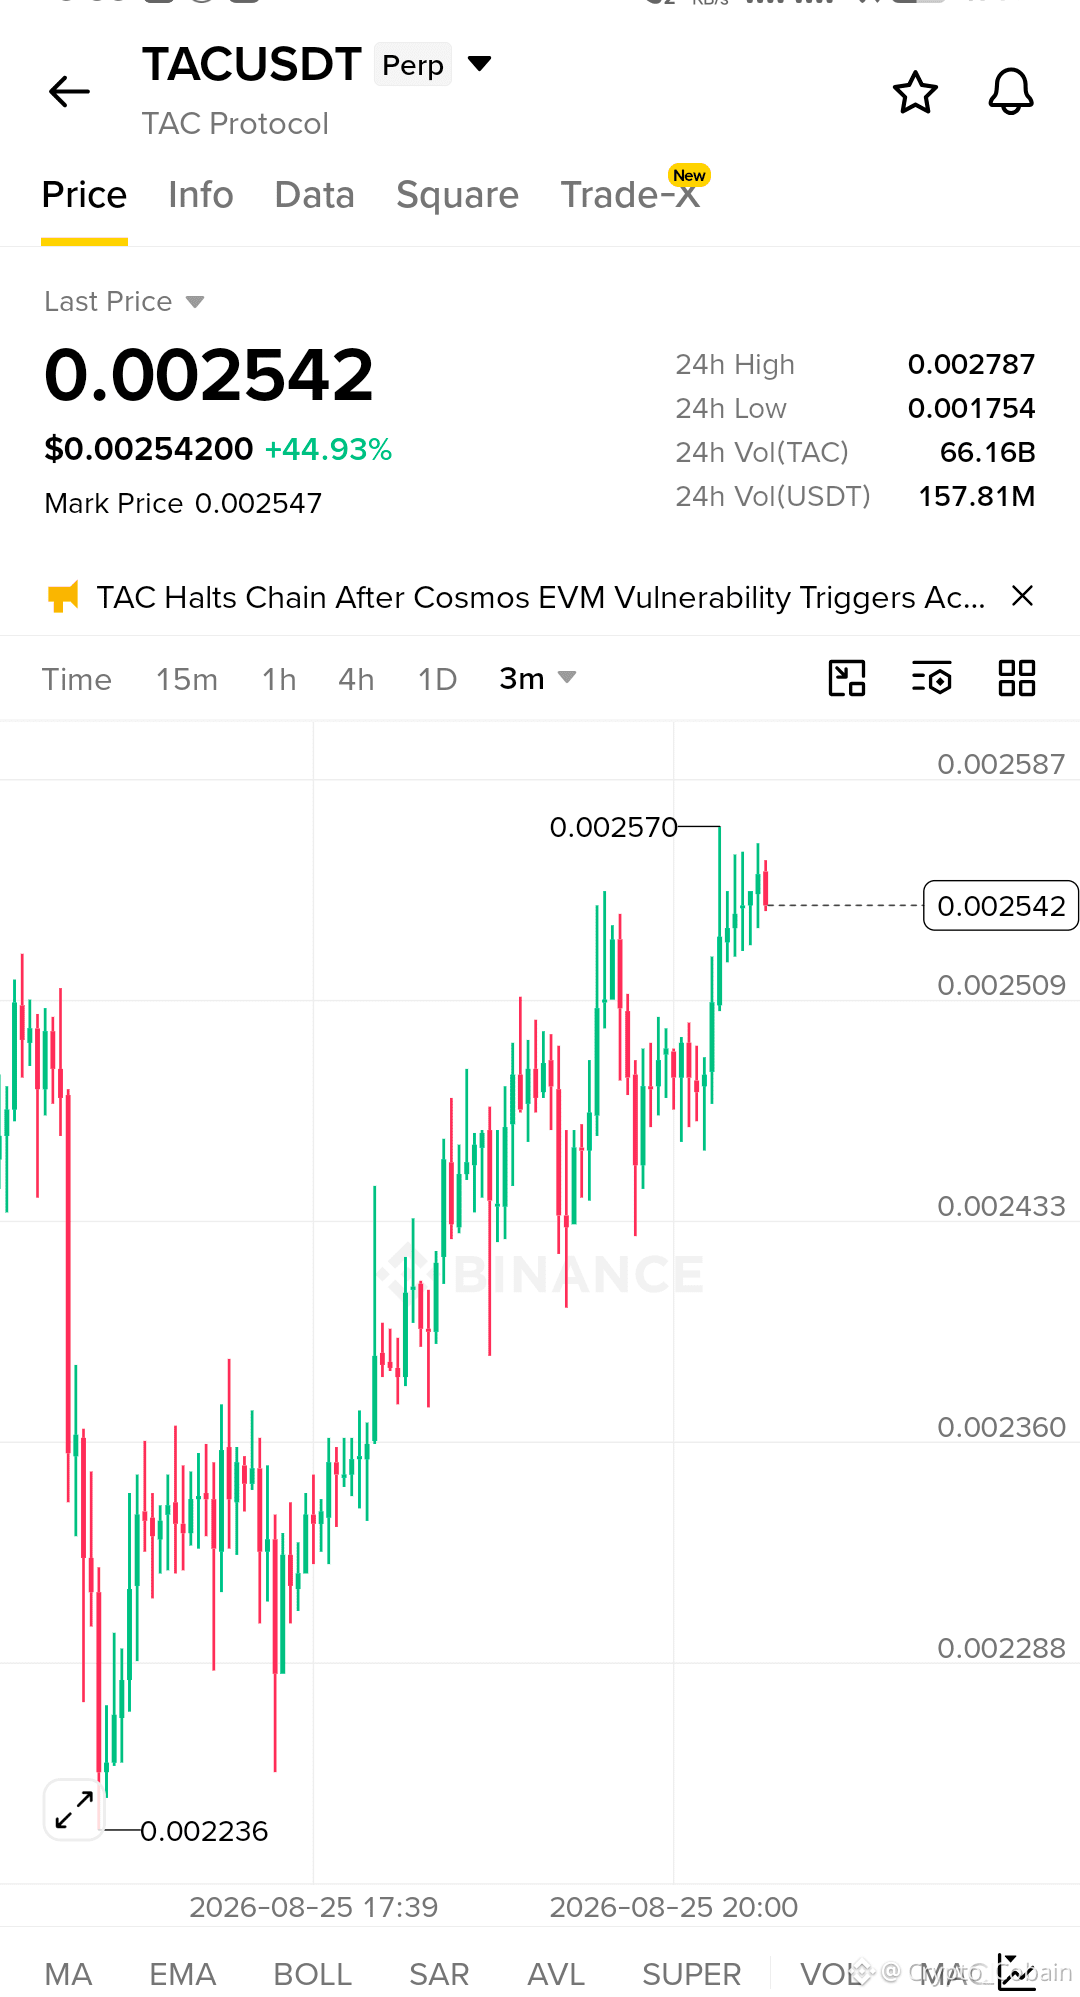
TAC just printed a massive recovery on the 3M chart, climbing from around 0.002236 to a fresh local high near 0.002570.
I’m watching this one closely because the structure has completely shifted. After the sharp sell-off, buyers stepped in, built a base, and started pushing higher highs and higher lows.
📍 Current Price: 0.002542
📈 24H Change: +44.93%
🔥 24H High: 0.002787
📊 24H Volume: 157.81M USDT
The interesting part is the momentum around 0.00250–0.00257. Price is currently holding close to the recent high, which tells me buyers are still fighting for control.
🎯 Key Levels I’m Watching:
• Resistance: 0.00257 → 0.002787
• Support: 0.00250 → 0.00243
• Deeper support: 0.00236
If TAC reclaims and holds above 0.00257, the next major area I’m watching is the 0.00278 zone. A clean breakout with strong volume could create another momentum leg.
But if price loses 0.00250, I’d expect a possible pullback toward the lower support areas before another attempt higher.
⚠️ One thing I’m not ignoring: the chart also shows a headline about a TAC chain halt following a Cosmos EVM vulnerability. That makes volatility and headline risk especially important here.
This is no longer a quiet chart.
🔥 Buyers have arrived.
🔥 Volume is elevated.
🔥 Structure is aggressively recovering.
⚡ Now the real question is whether TAC can turn 0.00257 from resistance into support.
I’m watching the breakout, the retest, and the volume reaction very closely.
DYOR — high volatility means the setup can change quickly.
🚀 $TAC is officially on my watchlist.
Follow for more crypto setups 📈
Share with your trading fam. 🤝
$TAC
#ThailandToExpandSECDigitalAssetProbePowers #OilHoldsLosses #SamsungSKHynixLeveragedETFsPostFirstMonthlyOutflow #KazakhstanCutsOilOutputForecastTo96MTons #HKJulyGoldNetExportsToMainland56.193Tons
TAC just printed a massive recovery on the 3M chart, climbing from around 0.002236 to a fresh local high near 0.002570.
I’m watching this one closely because the structure has completely shifted. After the sharp sell-off, buyers stepped in, built a base, and started pushing higher highs and higher lows.
📍 Current Price: 0.002542
📈 24H Change: +44.93%
🔥 24H High: 0.002787
📊 24H Volume: 157.81M USDT
The interesting part is the momentum around 0.00250–0.00257. Price is currently holding close to the recent high, which tells me buyers are still fighting for control.
🎯 Key Levels I’m Watching:
• Resistance: 0.00257 → 0.002787
• Support: 0.00250 → 0.00243
• Deeper support: 0.00236
If TAC reclaims and holds above 0.00257, the next major area I’m watching is the 0.00278 zone. A clean breakout with strong volume could create another momentum leg.
But if price loses 0.00250, I’d expect a possible pullback toward the lower support areas before another attempt higher.
⚠️ One thing I’m not ignoring: the chart also shows a headline about a TAC chain halt following a Cosmos EVM vulnerability. That makes volatility and headline risk especially important here.
This is no longer a quiet chart.
🔥 Buyers have arrived.
🔥 Volume is elevated.
🔥 Structure is aggressively recovering.
⚡ Now the real question is whether TAC can turn 0.00257 from resistance into support.
I’m watching the breakout, the retest, and the volume reaction very closely.
DYOR — high volatility means the setup can change quickly.
🚀 $TAC is officially on my watchlist.
Follow for more crypto setups 📈
Share with your trading fam. 🤝
$TAC
#ThailandToExpandSECDigitalAssetProbePowers #OilHoldsLosses #SamsungSKHynixLeveragedETFsPostFirstMonthlyOutflow #KazakhstanCutsOilOutputForecastTo96MTons #HKJulyGoldNetExportsToMainland56.193Tons