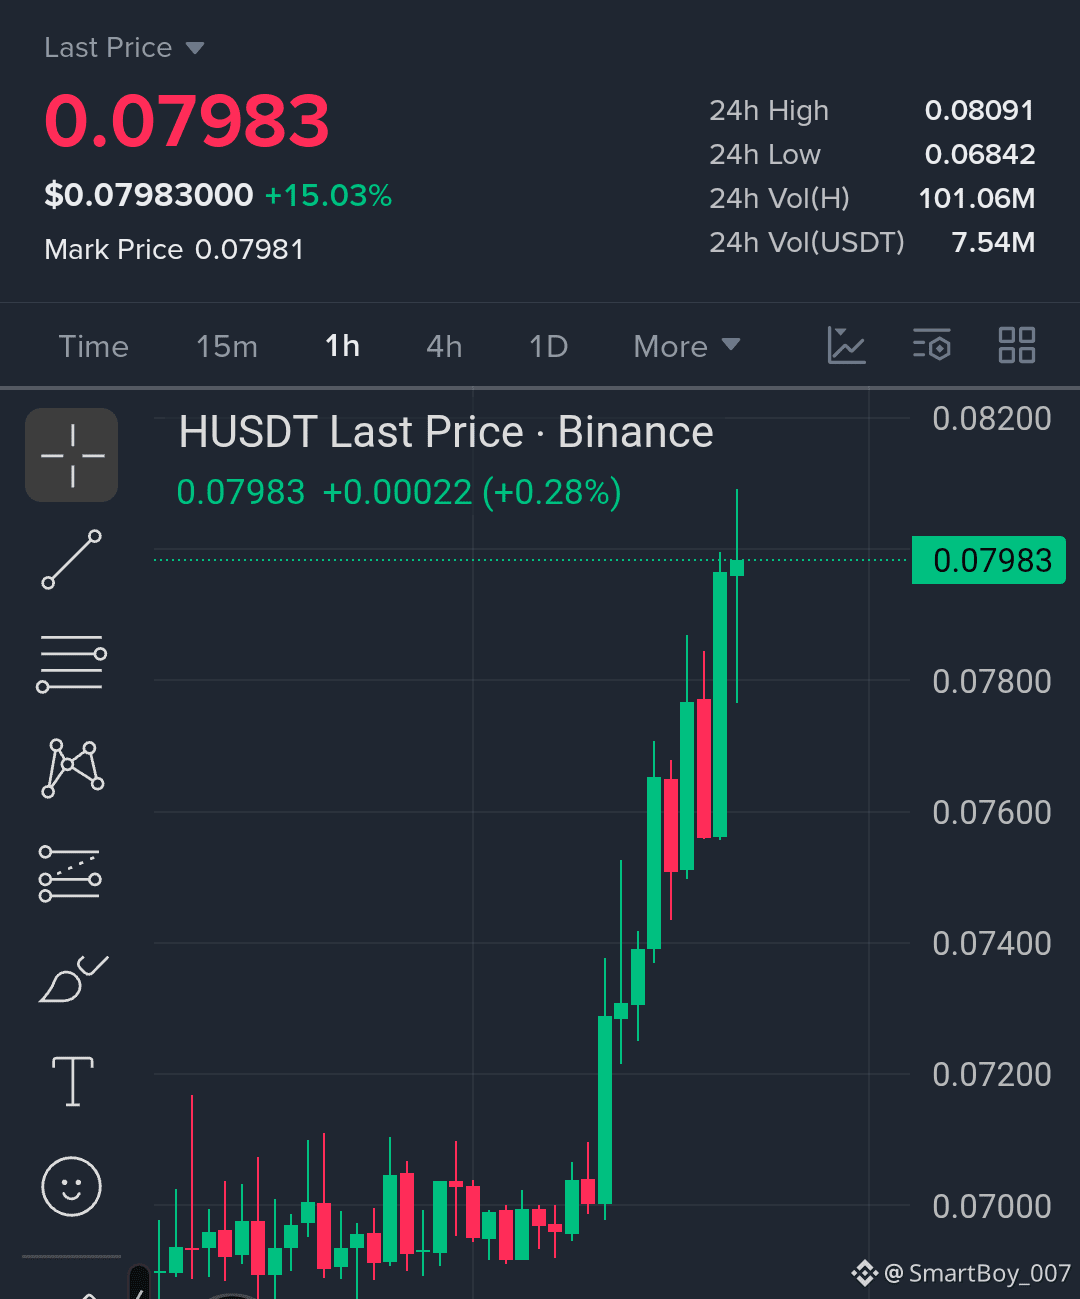

$H The 1H structure is showing strong momentum after breaking out of the $0.0700 consolidation zone, but price is now approaching the $0.0809 resistance area.
$H /USDT — LONG
Trade Plan
Entry: $0.0778–$0.0790
SL: $0.0752
TP1: $0.0810
TP2: $0.0835
TP3: $0.0860
Why this setup?
The 1H chart shows a clear bullish expansion from the $0.0700 base, followed by consecutive higher highs and higher lows. The large bullish candles indicate aggressive buying pressure, while the latest candles are holding close to the breakout area instead of immediately giving back the move. That makes $0.0778–$0.0790 an important potential retest zone.
MA 7, MA 25 and MA 99 are not displayed in the screenshot, so their exact alignment cannot be confirmed. For additional confirmation, MA 7 should remain above MA 25, with both positioned above MA 99 while price holds the breakout structure.
The main resistance is around $0.0809–$0.0810. A clean 1H breakout above this zone with expanding volume could open the way toward $0.0835 and $0.0860. If volume fades sharply, avoid chasing.
Invalidation is $0.0752; a decisive 1H close below this level would weaken the bullish setup.
Trade with controlled risk and wait for confirmation before entering; $H can move fast after a breakout.
$H /USDT — LONG
Trade Plan
Entry: $0.0778–$0.0790
SL: $0.0752
TP1: $0.0810
TP2: $0.0835
TP3: $0.0860
Why this setup?
The 1H chart shows a clear bullish expansion from the $0.0700 base, followed by consecutive higher highs and higher lows. The large bullish candles indicate aggressive buying pressure, while the latest candles are holding close to the breakout area instead of immediately giving back the move. That makes $0.0778–$0.0790 an important potential retest zone.
MA 7, MA 25 and MA 99 are not displayed in the screenshot, so their exact alignment cannot be confirmed. For additional confirmation, MA 7 should remain above MA 25, with both positioned above MA 99 while price holds the breakout structure.
The main resistance is around $0.0809–$0.0810. A clean 1H breakout above this zone with expanding volume could open the way toward $0.0835 and $0.0860. If volume fades sharply, avoid chasing.
Invalidation is $0.0752; a decisive 1H close below this level would weaken the bullish setup.
Trade with controlled risk and wait for confirmation before entering; $H can move fast after a breakout.