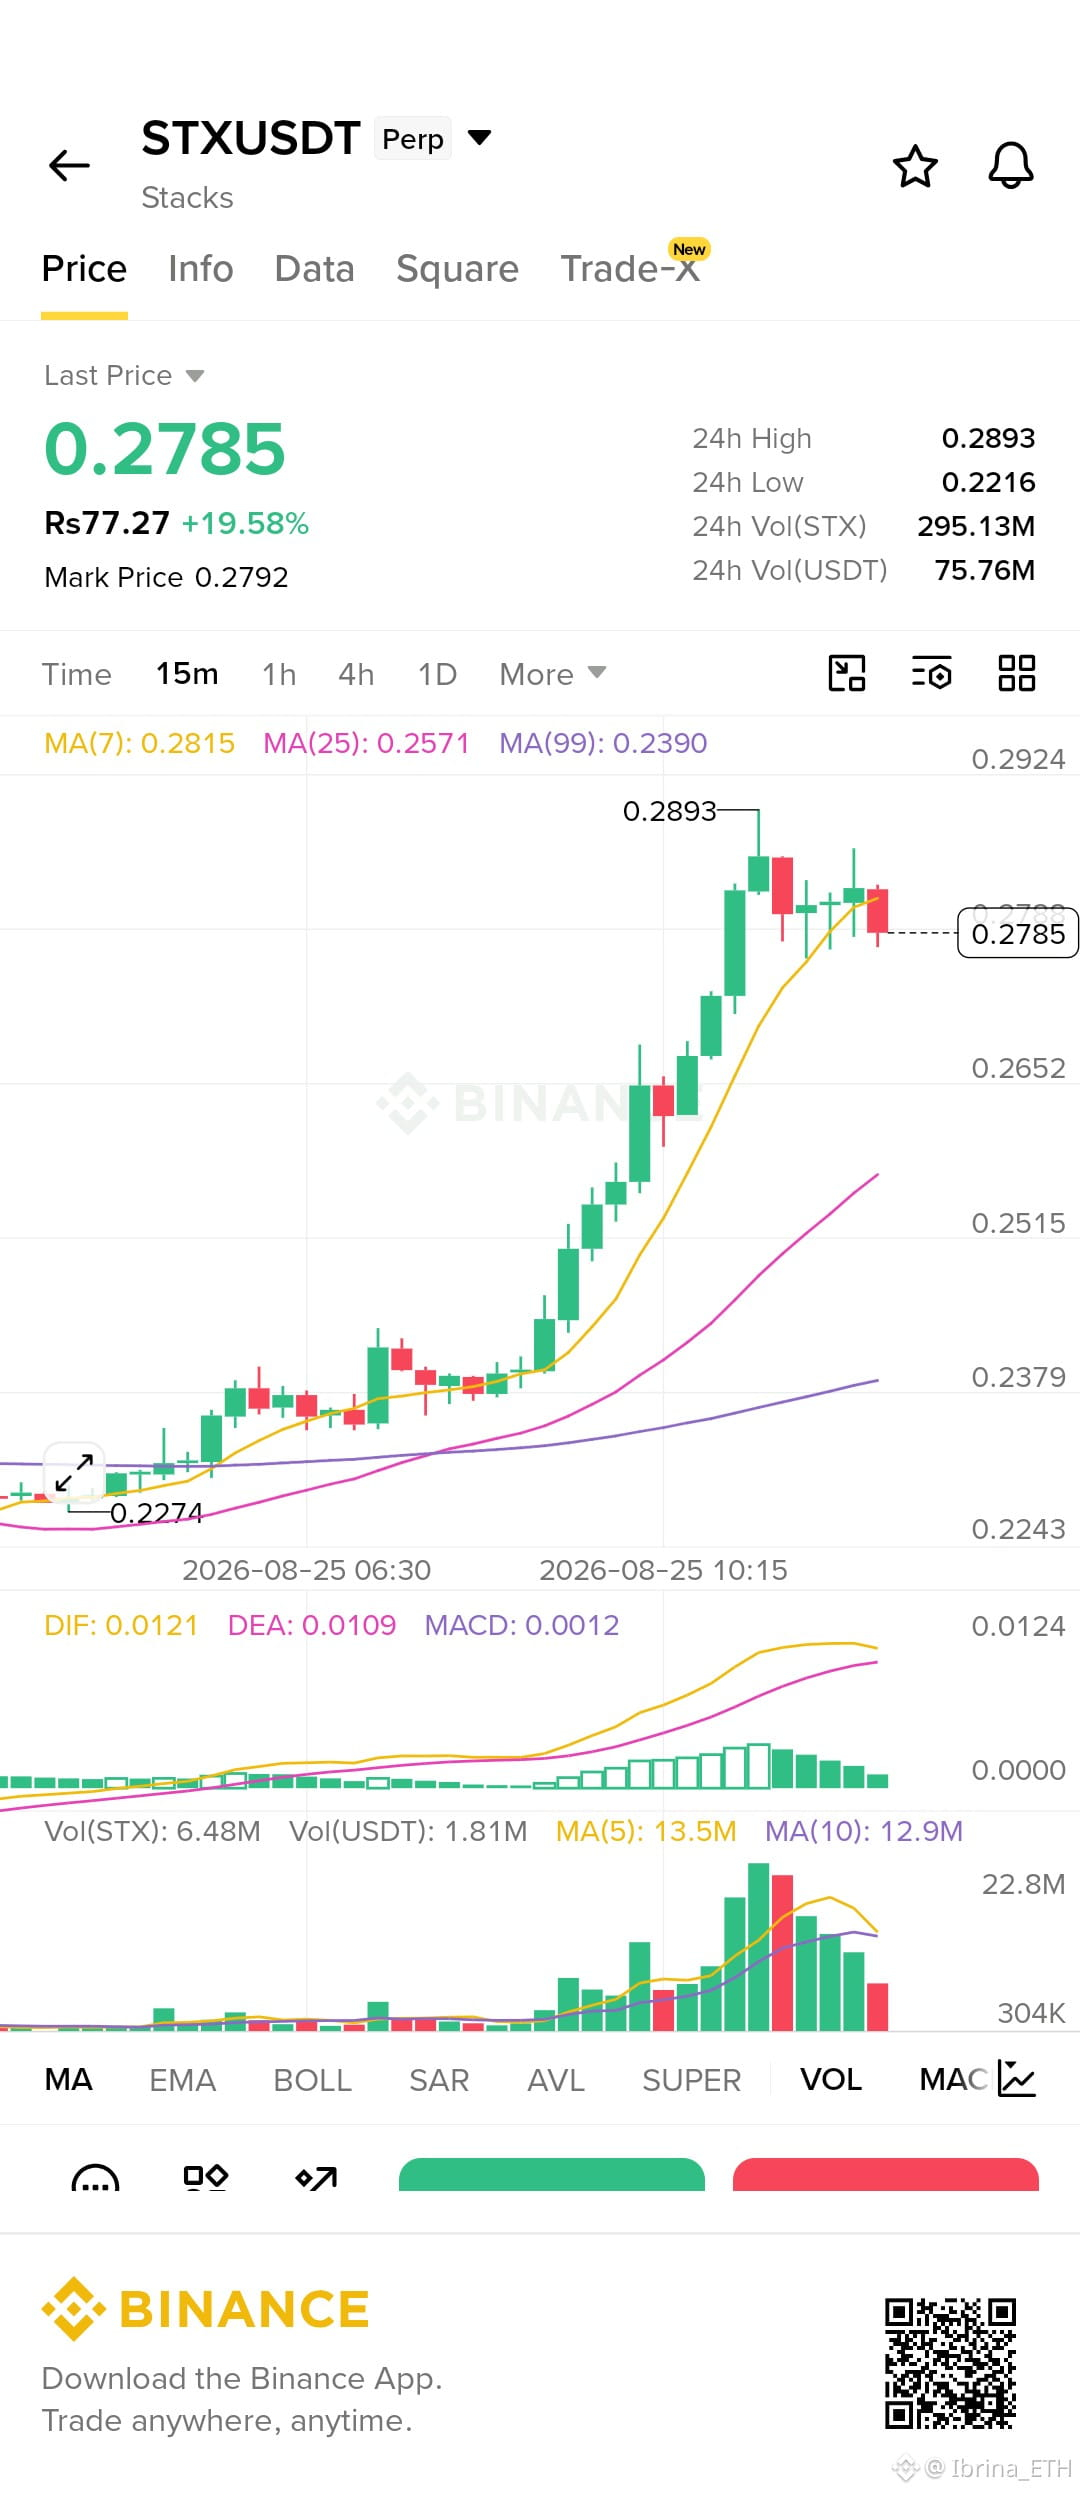

$STX caught my eye here because the move is actually pretty clean, but I’m not gonna lie, after a 19%+ push I don’t feel comfortable chasing it at the current candle.
On the 15m chart, STX moved from around 0.2274 and kept making higher highs and higher lows. The real acceleration started around the 0.25 area, and from there buyers basically took control. Price printed 0.2893 as the high and is now sitting near 0.2785.
One thing I’m watching is how price behaves after that spike.
The MA(7) is around 0.2815, while MA(25) is down at 0.2571 and MA(99) around 0.2390. So yeah, structure is still bullish, but price has stretched quite far away from the slower averages. Usually after a move like this, I’d rather see some cooling/consolidation instead of buying directly into the pump.
Volume also tells an interesting part of the story. It increased heavily during the breakout, which confirms there was real participation behind the move. But the latest candles are showing volume coming down compared with the biggest candles.
MACD is still positive too — DIF 0.0121, DEA 0.0109, MACD 0.0012 — but the histogram is getting smaller. For me, that’s not a sell signal, it’s just a reason to stop being aggressive here.
The level I’m personally keeping on my screen is roughly 0.265–0.270. If STX comes back there and buyers defend it properly, I’d be more interested. If it holds above the current area and takes 0.2893 with fresh volume, that would also change the picture for me.
What I don’t like is entering after a huge green move just because everyone starts feeling bullish. That’s usually where risk gets worse.
So right now I’m watching, not chasing. Let the chart show me what it wants to do next.
Just sharing my own market reading from the chart not a trading signal or financial advice.
On the 15m chart, STX moved from around 0.2274 and kept making higher highs and higher lows. The real acceleration started around the 0.25 area, and from there buyers basically took control. Price printed 0.2893 as the high and is now sitting near 0.2785.
One thing I’m watching is how price behaves after that spike.
The MA(7) is around 0.2815, while MA(25) is down at 0.2571 and MA(99) around 0.2390. So yeah, structure is still bullish, but price has stretched quite far away from the slower averages. Usually after a move like this, I’d rather see some cooling/consolidation instead of buying directly into the pump.
Volume also tells an interesting part of the story. It increased heavily during the breakout, which confirms there was real participation behind the move. But the latest candles are showing volume coming down compared with the biggest candles.
MACD is still positive too — DIF 0.0121, DEA 0.0109, MACD 0.0012 — but the histogram is getting smaller. For me, that’s not a sell signal, it’s just a reason to stop being aggressive here.
The level I’m personally keeping on my screen is roughly 0.265–0.270. If STX comes back there and buyers defend it properly, I’d be more interested. If it holds above the current area and takes 0.2893 with fresh volume, that would also change the picture for me.
What I don’t like is entering after a huge green move just because everyone starts feeling bullish. That’s usually where risk gets worse.
So right now I’m watching, not chasing. Let the chart show me what it wants to do next.
Just sharing my own market reading from the chart not a trading signal or financial advice.