$BNB

نشر

Mr_shumailtrader
·
--
$BNB — Monthly Market Update 📊
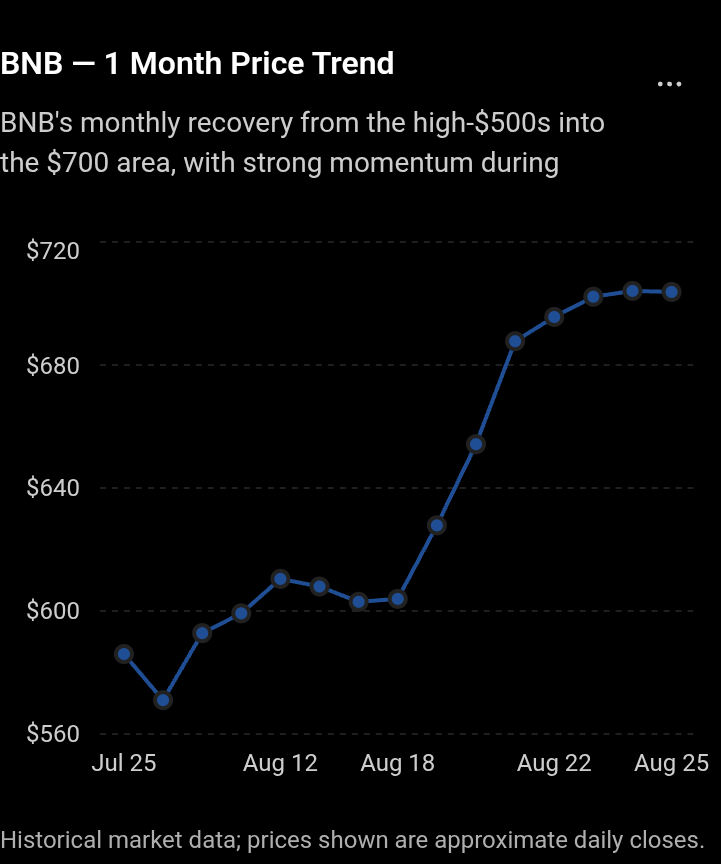
BNB has made a strong recovery over the past month, moving from the $570–$590 area toward $700+. The biggest acceleration came during the second half of August, with BNB breaking above the $650 and $680 zones.
1-Month Technical Analysis
• Current Price: ~$704
• Monthly Low Zone: ~$570–$590
• Recent High: ~$725
• Key Support: $680–$690
• Major Support: $650–$660
• Immediate Resistance: $720–$725
• Next Resistance: $750–$770
The monthly structure has shifted bullish, with BNB forming higher highs and higher lows after the July/August accumulation zone. Historical data shows the move accelerating from around $604 on Aug 18 to ~$704 by Aug 24.
🔥 Bullish Scenario:
A strong daily close above $725 could open the path toward $750 → $770.
⚠️ Bearish Scenario:
A breakdown below $680 could trigger a pullback toward $650–$660. Losing $650 would weaken the current bullish structure.
BNB is currently testing an important resistance zone after a powerful monthly recovery. The next major move will likely depend on whether buyers can sustain price above $720–$725.
#bnb #BNB_Market_Update $BNB
BNB has made a strong recovery over the past month, moving from the $570–$590 area toward $700+. The biggest acceleration came during the second half of August, with BNB breaking above the $650 and $680 zones.
1-Month Technical Analysis
• Current Price: ~$704
• Monthly Low Zone: ~$570–$590
• Recent High: ~$725
• Key Support: $680–$690
• Major Support: $650–$660
• Immediate Resistance: $720–$725
• Next Resistance: $750–$770
The monthly structure has shifted bullish, with BNB forming higher highs and higher lows after the July/August accumulation zone. Historical data shows the move accelerating from around $604 on Aug 18 to ~$704 by Aug 24.
🔥 Bullish Scenario:
A strong daily close above $725 could open the path toward $750 → $770.
⚠️ Bearish Scenario:
A breakdown below $680 could trigger a pullback toward $650–$660. Losing $650 would weaken the current bullish structure.
BNB is currently testing an important resistance zone after a powerful monthly recovery. The next major move will likely depend on whether buyers can sustain price above $720–$725.
#bnb #BNB_Market_Update $BNB
إخلاء مسؤولية: يتضمن آراء جهات خارجية. لا تُعدّ نصيحة. يُمكن استخدام Binance AI دون أي ضمان. اطلع على الشروط والأحكام.