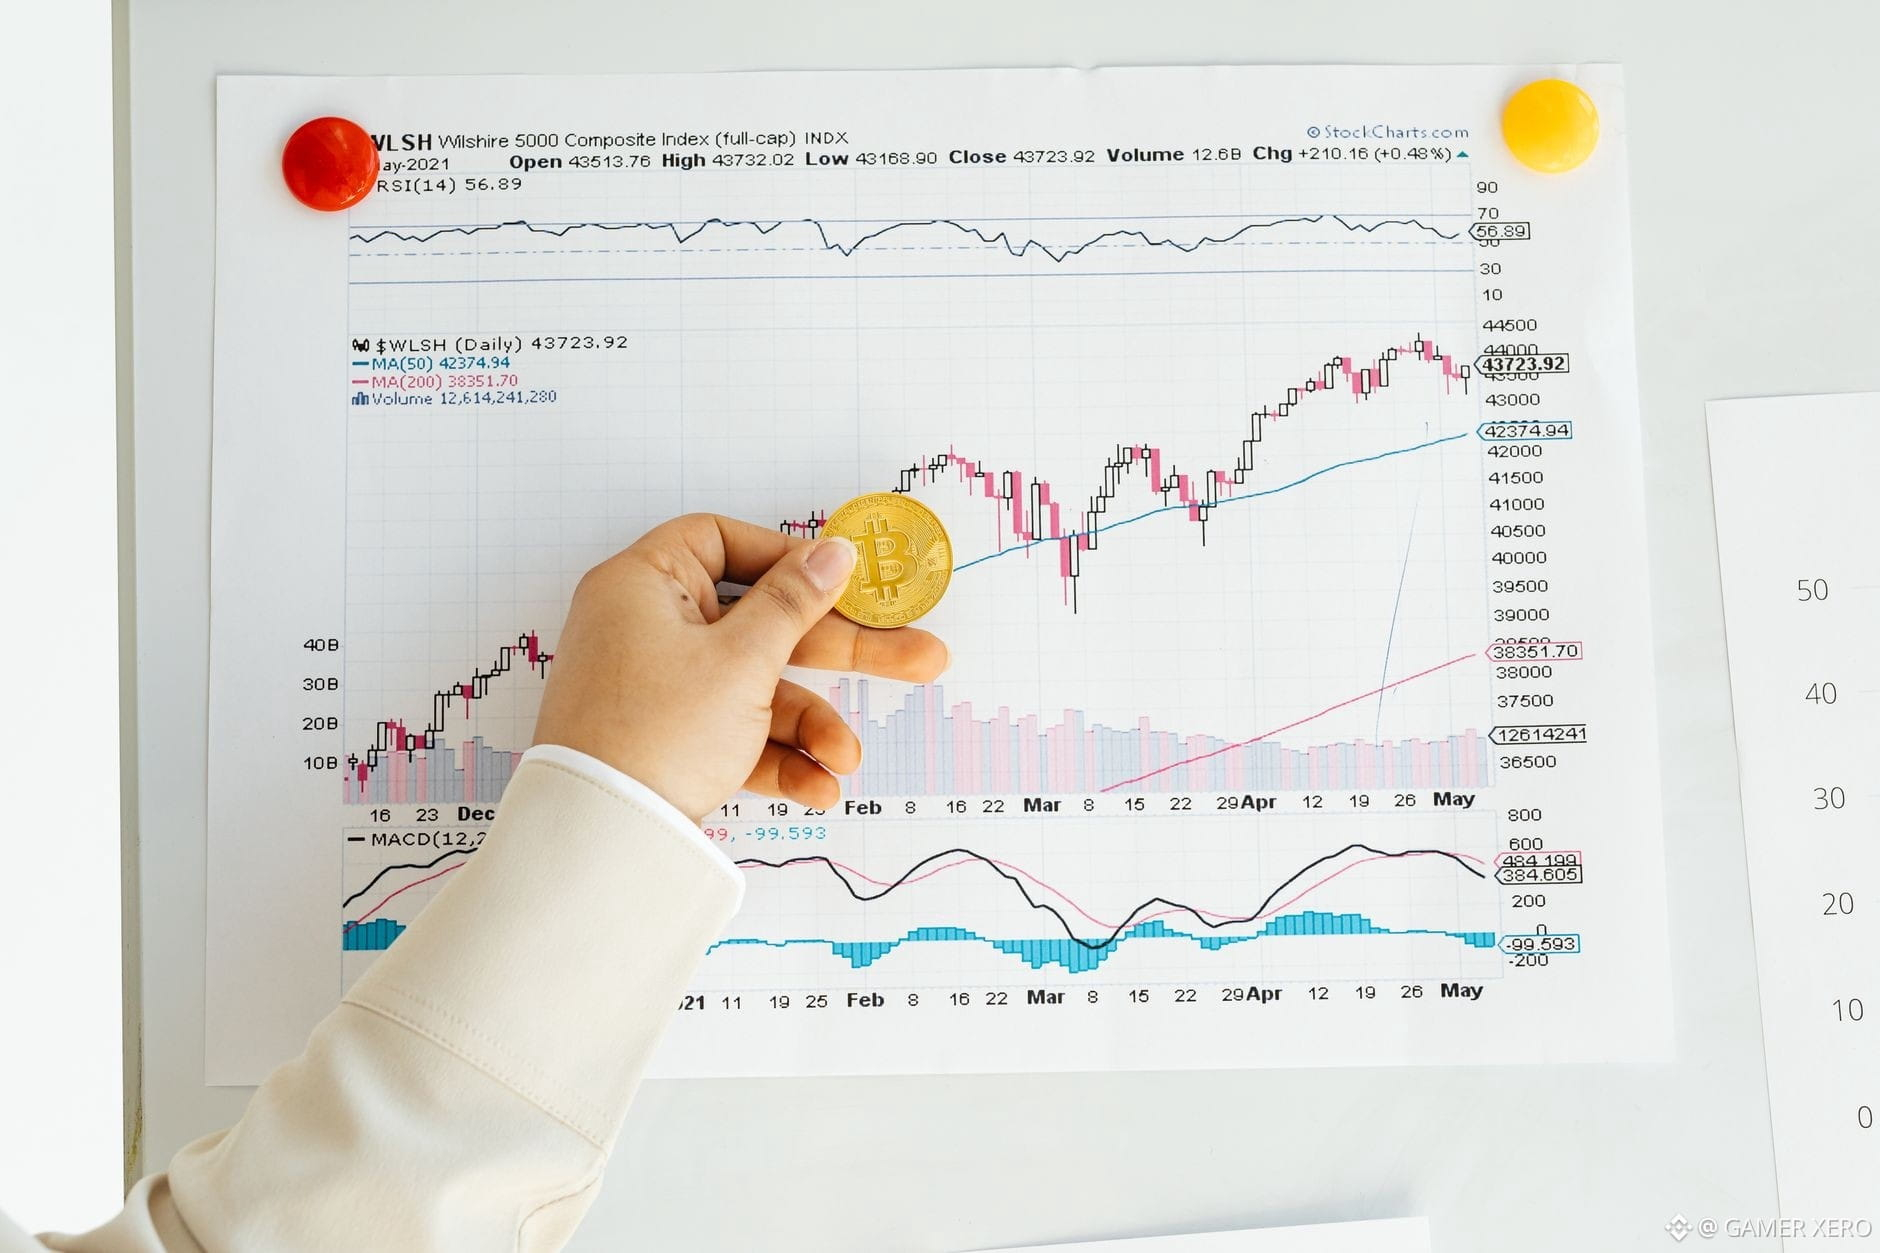
The $BTC chart has been stuck in a tight band between $75,907 and $78,053 for the past 24 hours. A 1.8 % gain kept it near the top of that range, but the lack of a decisive breakout suggests sellers are still anchoring near the low‑200 day support while buyers protect the recent high. On the upside, the $78,050 level aligns with the prior day’s swing high and a cluster of pending stop‑loss orders, so a move above that could trigger short‑covering. Below $75,900, we see the next liquidity pool where the last deep pull‑back occurred in early June.
$ETH mirrors this pattern, holding above the $2,386 floor and flirting with the $2,485 ceiling. The 2.9 % daily rise is being fueled by fresh inflows into DeFi protocols and a modest uptick in on‑chain activity, yet the price still respects the same narrow corridor. Both assets are trading with a bullish bias but limited momentum, a sign that the market is digesting macro signals – the latest commentary from major investors urging a tilt toward gold and Bitcoin, plus Japanese funds shifting over ¥5 trillion into foreign assets, which adds a layer of cautious optimism without a rush of speculative capital.
With range‑bound action, many traders are turning to order‑book analysis and volume clusters to time entries rather than chasing price targets. How are you adjusting your short‑term plan when the market respects a clear support‑resistance box?
#CryptoAnalysis #BTC #ETH #GAMERXERO
$ETH mirrors this pattern, holding above the $2,386 floor and flirting with the $2,485 ceiling. The 2.9 % daily rise is being fueled by fresh inflows into DeFi protocols and a modest uptick in on‑chain activity, yet the price still respects the same narrow corridor. Both assets are trading with a bullish bias but limited momentum, a sign that the market is digesting macro signals – the latest commentary from major investors urging a tilt toward gold and Bitcoin, plus Japanese funds shifting over ¥5 trillion into foreign assets, which adds a layer of cautious optimism without a rush of speculative capital.
With range‑bound action, many traders are turning to order‑book analysis and volume clusters to time entries rather than chasing price targets. How are you adjusting your short‑term plan when the market respects a clear support‑resistance box?
#CryptoAnalysis #BTC #ETH #GAMERXERO