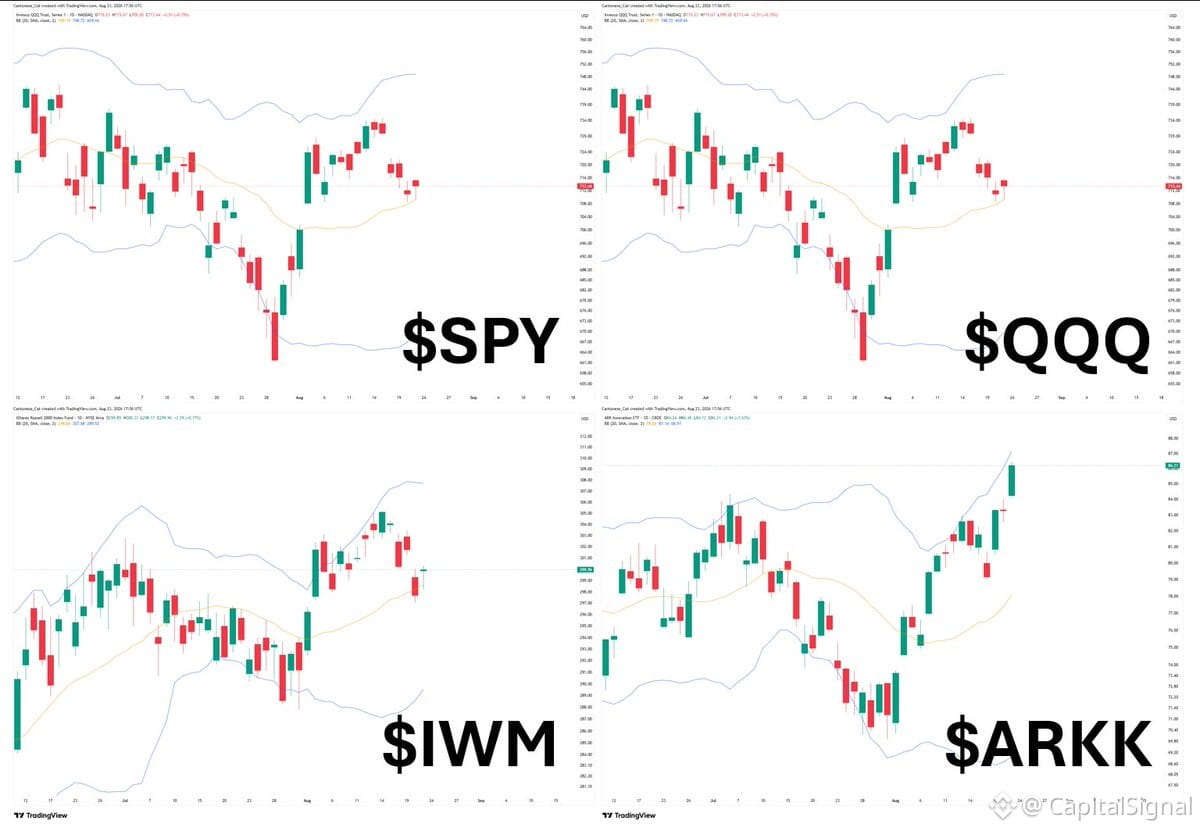
One of these daily charts is screaming a different story. $SPY $QQQ $IWM $ARKK
Look at the divergence here. While the majors are grinding higher or consolidating near highs, one of these is showing serious relative weakness or a completely different technical setup. This kind of spread matters for positioning—if you're long the laggard expecting mean reversion, you're fighting the tape. If you're short the outlier, you're betting on continued underperformance.
My read: $ARKK is the odd one out. Innovation/growth is getting left behind as money rotates into mega-cap tech ($QQQ leadership) and value/small-caps ($IWM). $SPY is the blended middle. The divergence tells you where the real conviction is—and where it isn't. If you're holding high-beta growth names, this chart is your warning shot.
Look at the divergence here. While the majors are grinding higher or consolidating near highs, one of these is showing serious relative weakness or a completely different technical setup. This kind of spread matters for positioning—if you're long the laggard expecting mean reversion, you're fighting the tape. If you're short the outlier, you're betting on continued underperformance.
My read: $ARKK is the odd one out. Innovation/growth is getting left behind as money rotates into mega-cap tech ($QQQ leadership) and value/small-caps ($IWM). $SPY is the blended middle. The divergence tells you where the real conviction is—and where it isn't. If you're holding high-beta growth names, this chart is your warning shot.