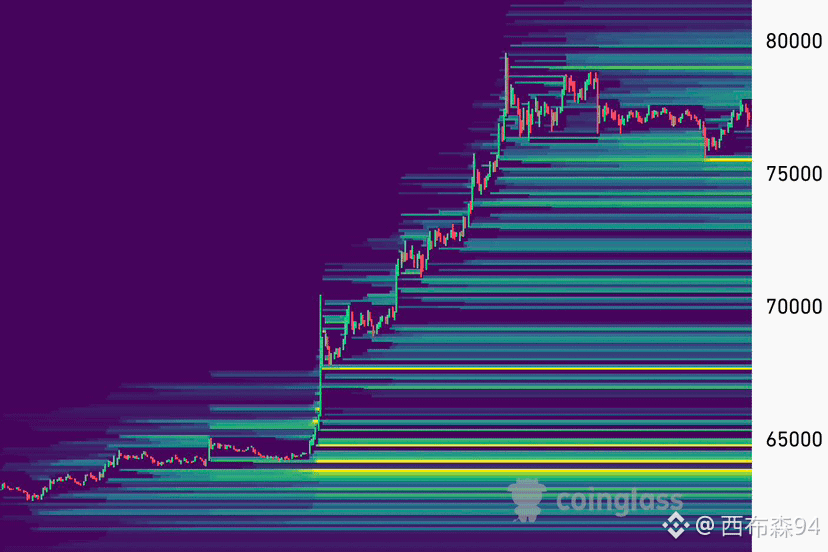
$BTC liquidity map is getting interesting.
$BTC is now around $77K, and there is a lot of liquidity sitting around $78K–$80K, while another big liquidity area is below around $75K–$73K.
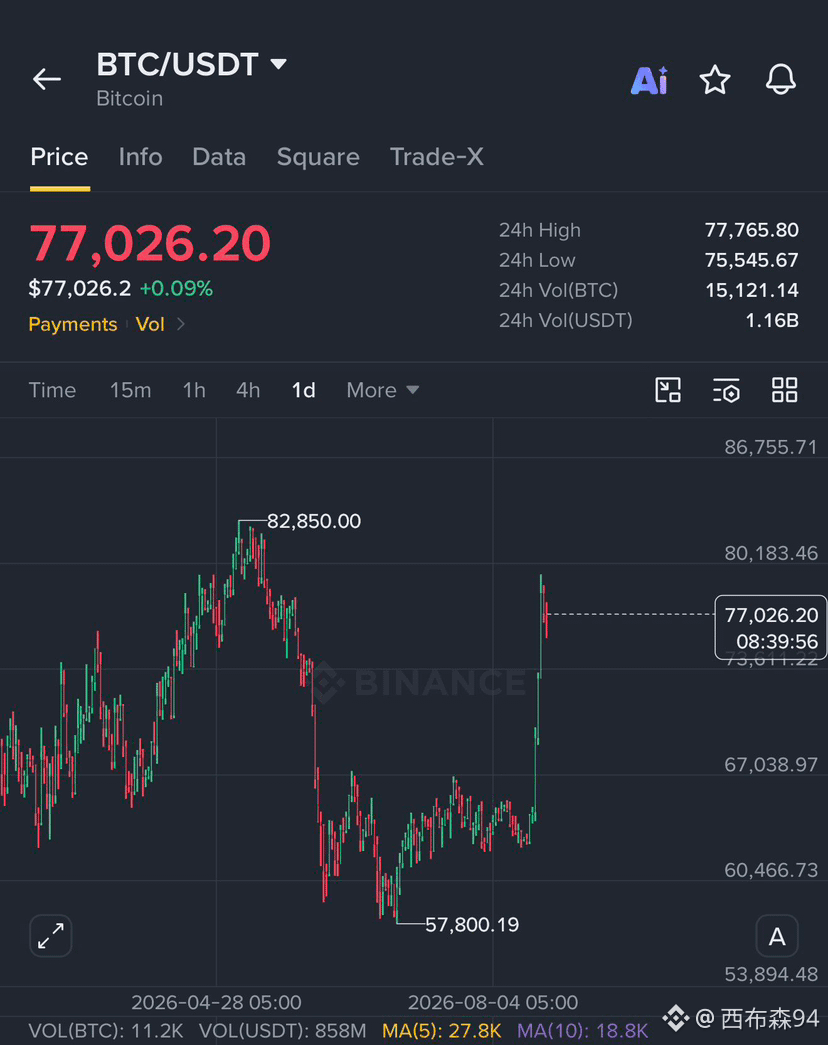
The daily chart is already very stretched with RSI above 85, so a pullback is definitely possible.
I think BTC is more likely to take the $78K–$80K liquidity first before any bigger pullback.
If BTC gets rejected hard there, then it will dump towards $70K.
But if $80K breaks cleanly and holds, then it will pump more towards the $90K area.
Click here to trade 👇🏼
$BTC
$BTC is now around $77K, and there is a lot of liquidity sitting around $78K–$80K, while another big liquidity area is below around $75K–$73K.
The daily chart is already very stretched with RSI above 85, so a pullback is definitely possible.
I think BTC is more likely to take the $78K–$80K liquidity first before any bigger pullback.
If BTC gets rejected hard there, then it will dump towards $70K.
But if $80K breaks cleanly and holds, then it will pump more towards the $90K area.
Click here to trade 👇🏼
$BTC