
Bitcoin’s recent performance has been strong. What’s less clear is whether that strength is spreading across timeframes.
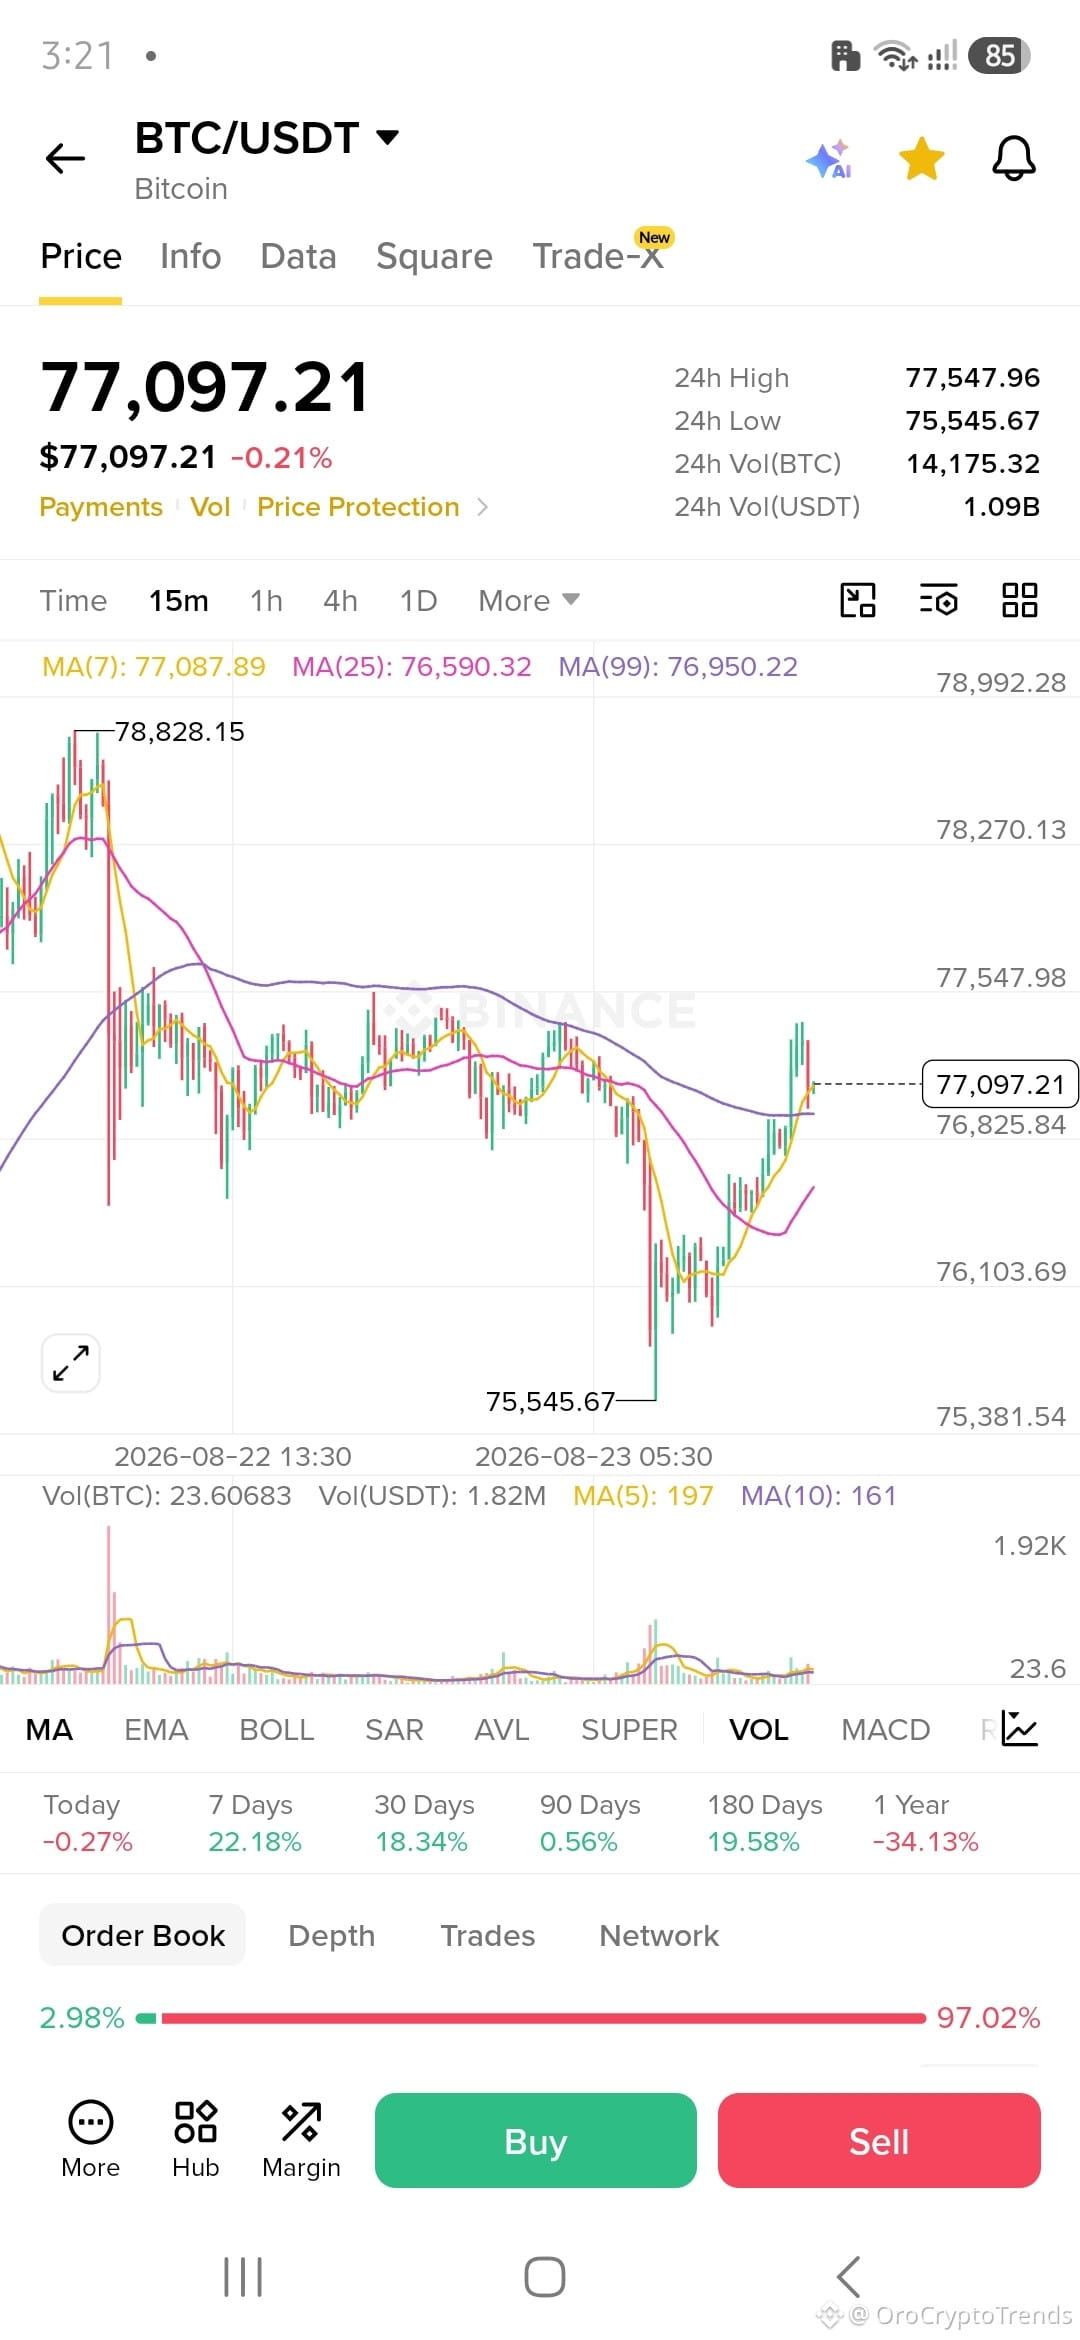
BTC is trading around $77.1K, after gaining roughly 22.2% over the past 7 days and 18.35% over 30 days. On the 4H and 1D charts, price remains above the 7, 25, and 99 moving averages.
But the 1H picture is less decisive. BTC is above the 99 MA while sitting slightly below the 7 and 25 MAs. That doesn’t invalidate the higher-timeframe structure, but it does show that short-term momentum isn’t moving in complete alignment with it.
There’s another detail I find important: the recent move looks much stronger over 7 and 30 days than over 90 days, where performance is only around +0.57%. At the same time, BTC is still roughly 34% below its 1-year level.
So I wouldn’t reduce the current setup to simply “Bitcoin is bullish.”
The more useful question is whether the market can turn this recent advance into broader, multi-timeframe strength.
The ~$79.5K area also matters because it appears as a recent high on the supplied 4H/1H charts. For now, the ~$79.5K area remains a useful reference point when assessing whether the recent consolidation is resolving into a new directional move.
For now, the higher-timeframe trend looks stronger than the immediate momentum.
$BTC #BTC
BTC is trading around $77.1K, after gaining roughly 22.2% over the past 7 days and 18.35% over 30 days. On the 4H and 1D charts, price remains above the 7, 25, and 99 moving averages.
But the 1H picture is less decisive. BTC is above the 99 MA while sitting slightly below the 7 and 25 MAs. That doesn’t invalidate the higher-timeframe structure, but it does show that short-term momentum isn’t moving in complete alignment with it.
There’s another detail I find important: the recent move looks much stronger over 7 and 30 days than over 90 days, where performance is only around +0.57%. At the same time, BTC is still roughly 34% below its 1-year level.
So I wouldn’t reduce the current setup to simply “Bitcoin is bullish.”
The more useful question is whether the market can turn this recent advance into broader, multi-timeframe strength.
The ~$79.5K area also matters because it appears as a recent high on the supplied 4H/1H charts. For now, the ~$79.5K area remains a useful reference point when assessing whether the recent consolidation is resolving into a new directional move.
For now, the higher-timeframe trend looks stronger than the immediate momentum.
$BTC #BTC