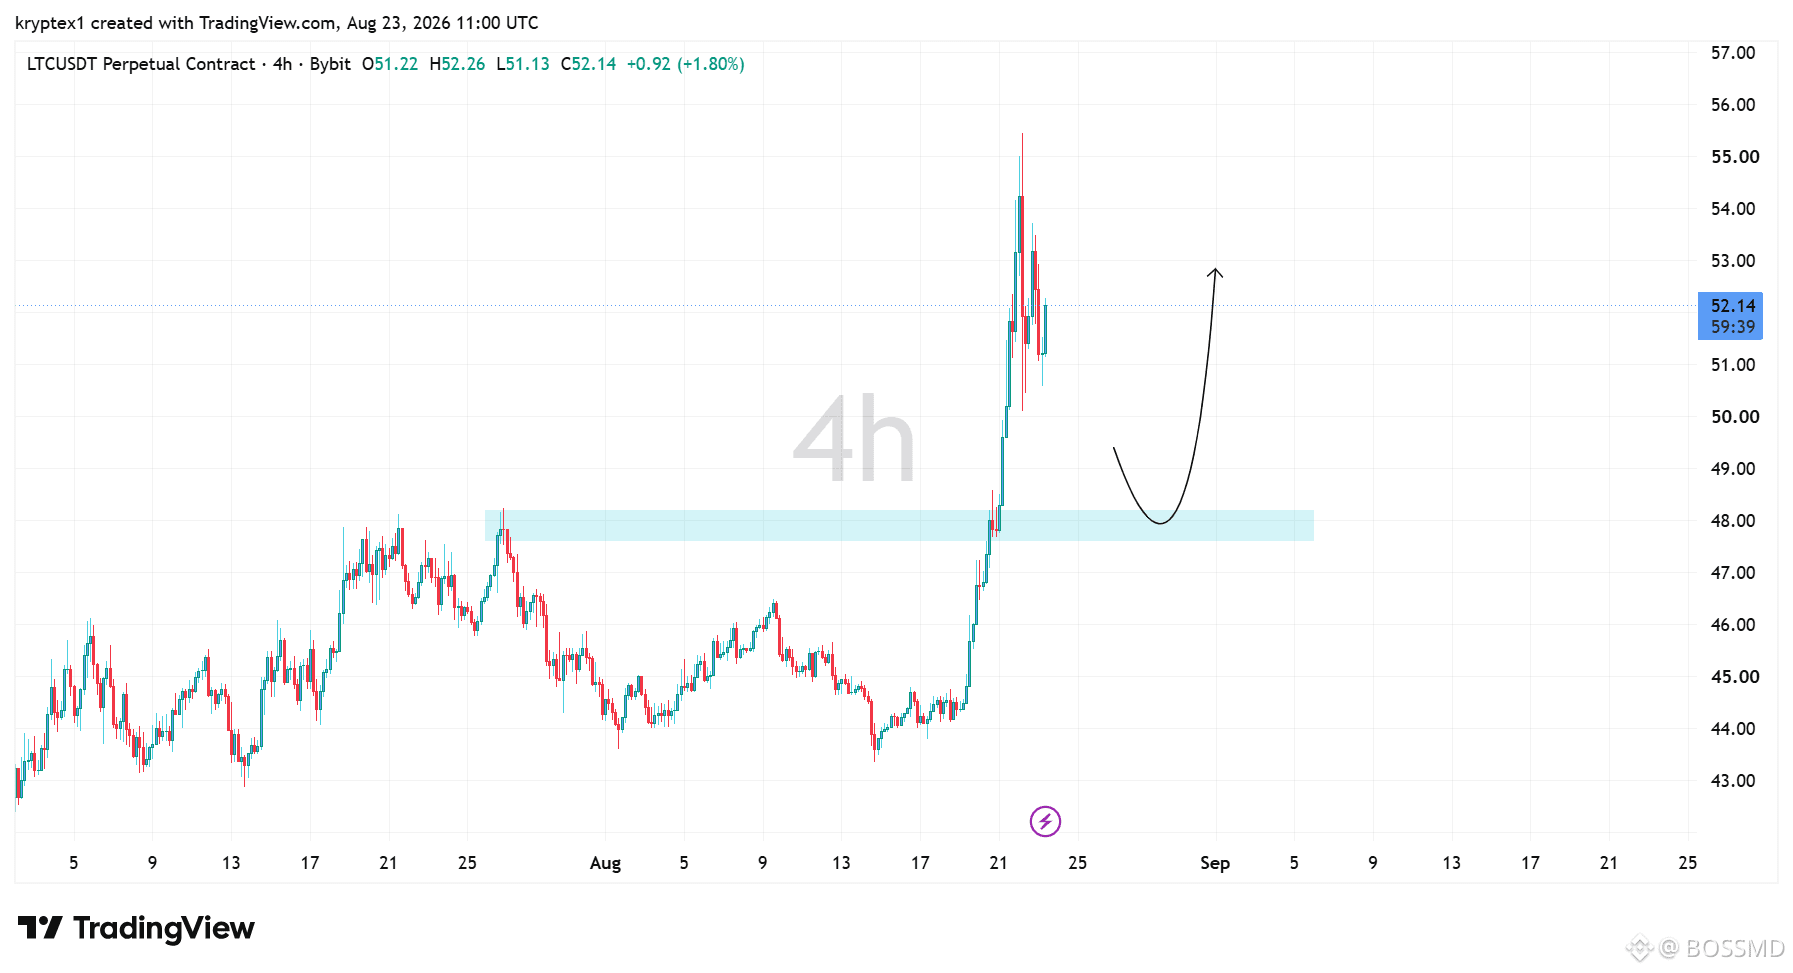
$LTC is currently trading around $52.14 on the 4H chart, and the recent move has definitely caught my attention.
Price spent a good amount of time ranging between roughly $44–$48 before finally breaking above the previous resistance around $48 with strong momentum.
That breakout pushed #LTC quickly toward the $54–$55 area, showing that buyers are currently in control of the short-term structure.
But after a move this aggressive, I wouldn’t be surprised to see a pullback. The key zone on my chart is the $47.70–$48.30 region. This was previously resistance, so I want to see whether it can now act as support.
If LTC pulls back into this zone, holds it, and starts showing another bullish reaction, I’d be watching for a continuation toward $53–$55, with the possibility of pushing higher if momentum remains strong.
The important part for me is not simply “LTC is pumping.” It’s whether the breakout can actually hold. A successful resistance-to-support flip would make the current structure much healthier.
On the other hand, if LTC loses the $47–$48 zone decisively, the breakout could turn into a false move and we may need to see more consolidation before another attempt higher.
Price spent a good amount of time ranging between roughly $44–$48 before finally breaking above the previous resistance around $48 with strong momentum.
That breakout pushed #LTC quickly toward the $54–$55 area, showing that buyers are currently in control of the short-term structure.
But after a move this aggressive, I wouldn’t be surprised to see a pullback. The key zone on my chart is the $47.70–$48.30 region. This was previously resistance, so I want to see whether it can now act as support.
If LTC pulls back into this zone, holds it, and starts showing another bullish reaction, I’d be watching for a continuation toward $53–$55, with the possibility of pushing higher if momentum remains strong.
The important part for me is not simply “LTC is pumping.” It’s whether the breakout can actually hold. A successful resistance-to-support flip would make the current structure much healthier.
On the other hand, if LTC loses the $47–$48 zone decisively, the breakout could turn into a false move and we may need to see more consolidation before another attempt higher.