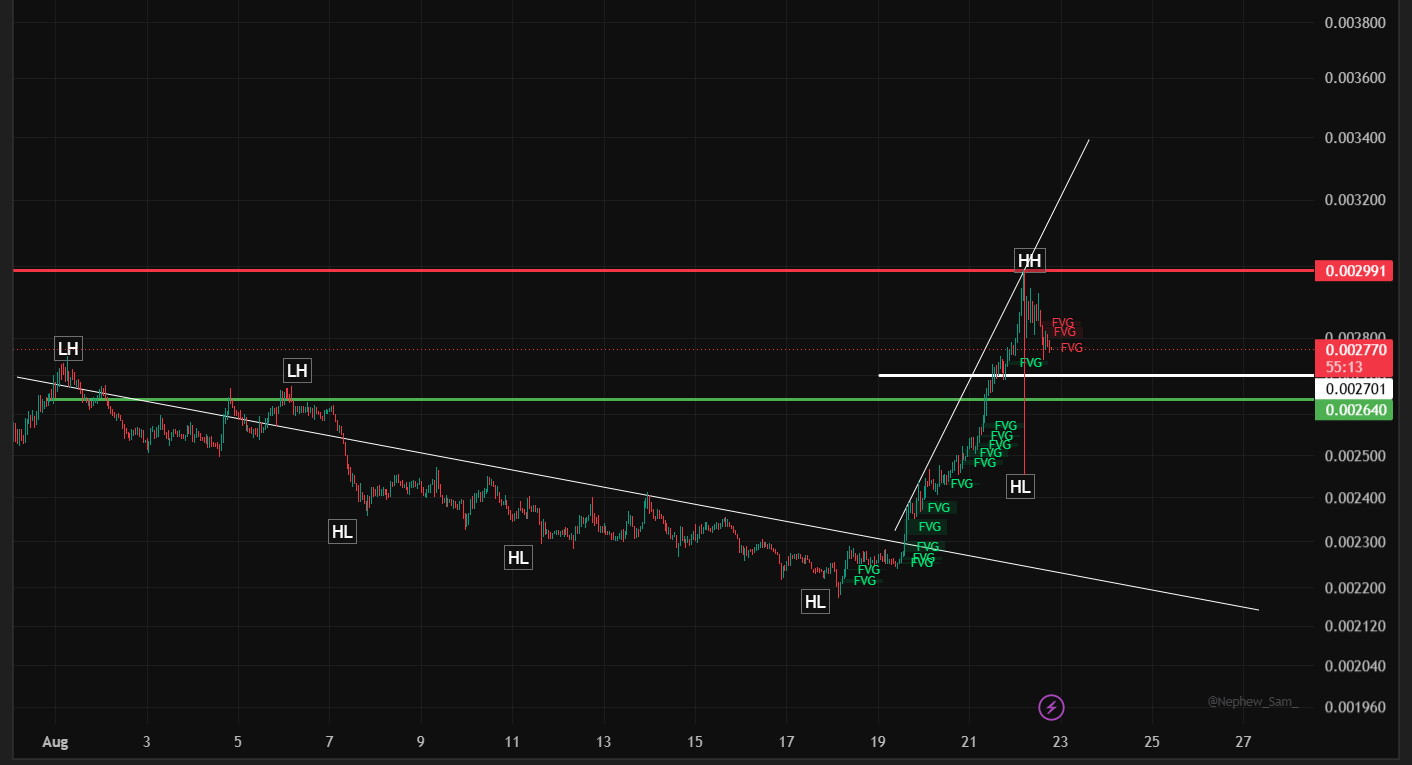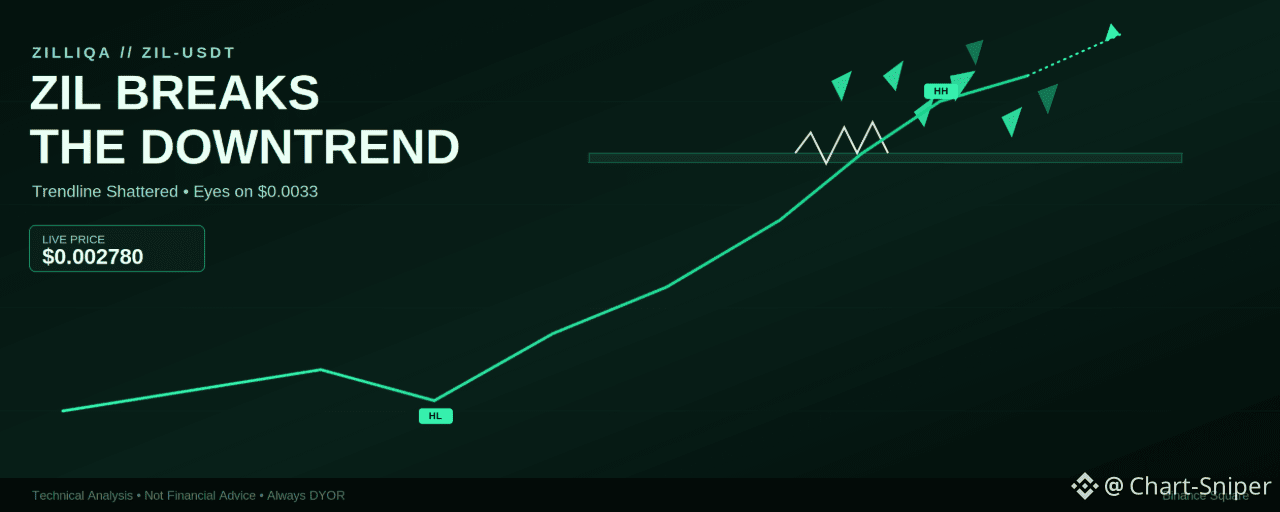

After nearly three weeks trapped inside a falling wedge, Zilliqa (ZIL) has done something it hasn't managed since early August — it broke clean through its descending trendline, ripped to a fresh Higher High, and is now holding its retest. That's the kind of structural shift worth paying attention to.
Market Snapshot
ZIL/USDT is trading around $0.002780 on Binance Perpetuals at the time of writing, down slightly on the last hourly candle (O $0.002792 / H $0.002794 / L $0.002773 / C $0.002780, −0.43%) after tagging an intraday high of $0.002991. The pullback is happening on top of the broken trendline rather than back below it — the first real test of whether this reversal has legs.
Structure Breakdown
The hourly chart tells a two-act story:
The downtrend (Aug 1–19): ZIL spent nearly three weeks grinding lower inside a well-respected descending channel, printing a series of Lower Highs (~$0.00292, then ~$0.00283) and stepping lower through several Higher Low pauses along the way — classic bearish structure that persisted for over two weeks.
The reversal (Aug 19–22): From a low near $0.00230, price broke decisively above the multi-week descending trendline, tearing through a dense stack of bullish FVGs on the way to a Higher High at $0.002991 — the first Higher High this pair has printed since the downtrend began.
Current retest: After tagging the high, ZIL pulled back to a Higher Low near $0.002640, then bounced and is now consolidating around $0.002701–$0.002780 — right on top of the broken trendline. Holding this zone is what would confirm the reversal is real rather than a fakeout.
Key Levels to Watch
Immediate support: $0.002701 (white structural level, sitting right on the broken trendline)
Deeper support: $0.002640 (green level, the post-breakout Higher Low)
Invalidation zone: below $0.002550 (a close back beneath this would put the reversal in serious doubt)
Resistance 1: $0.002991 (the current Higher High)
Resistance 2 (trendline extension target): roughly $0.0033–$0.0034
Trade Setups (Not Financial Advice)
Setup 1 — Trendline Retest (lower risk, higher probability)
Entry zone: $0.002640 – $0.002701, on a hold of the reclaimed trendline and Higher Low
Stop loss: below $0.002550 (a clean break back under the reversal structure)
Target 1: $0.002991
Target 2: $0.0033
Risk-to-reward: roughly 1:2.5 to 1:3.5 depending on fill location
Setup 2 — Momentum Continuation (higher risk, for confirmation traders)
Entry trigger: a 1h candle close above $0.002995
Stop loss: $0.002780 (below the current consolidation low)
Target 1: $0.0033
Target 2: $0.0035 if volume expands
Invalidation: A clean close below $0.002550 would suggest the breakout has failed and ZIL is rolling back into its prior downtrend — in that scenario, the next real support sits back near $0.00230, where the reversal originally began.
The Bigger Picture
The most important thing on this chart isn't the size of the rally — it's the trendline break itself. A multi-week descending structure getting decisively taken out, followed by a Higher Low that holds on the retest, is one of the more reliable early signs of a trend change. That said, ZIL has failed similar reversal attempts before over its longer downtrend, so this retest zone ($0.002640–$0.002701) is the real test: hold it, and the path toward $0.002991 and $0.0033 stays open. Lose it, and this starts to look like just another lower high inside the bigger downtrend.
Low-priced altcoins like ZIL can be volatile and prone to sharp wicks, so treat these levels as a framework and always trade with a stop loss.
This article is for informational purposes only and does not constitute financial advice. Cryptocurrency trading carries significant risk of loss. Always do your own research (DYOR) and manage risk according to your own risk tolerance before trading.
@Binance Square Official #USCanadaTradeTalksCollapseCanadaVowsRetaliation #SP500EndsWeeklyWinStreak #TRUMPBreaksAbove$3.4HighestSinceMarch21 #Binance #ChartSniper