Everyone is staring at the 15m RSI at 29, but the 4h chart is telling a completely different story for $LAB /USDT.
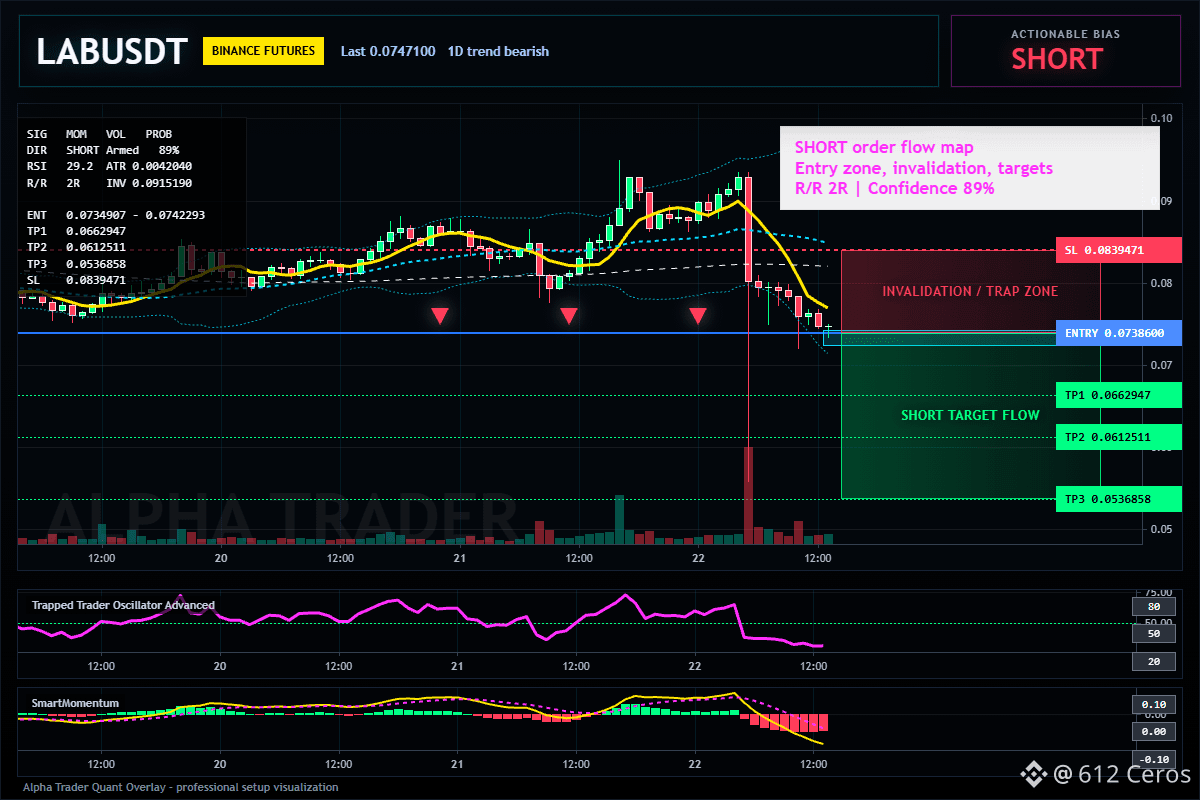
$LAB - 🟢 SHORT · Conf 89%
Trade Plan:
Entry: 0.0734907 – 0.0742293
SL: 0.0839471
TP1: 0.0662947
TP2: 0.0612511
TP3: 0.0536858
Why this setup?
- The daily trend is bearish, and the 4h structure confirms we are in a trend regime, not a range.
- The 15m RSI at 29.19 looks "oversold", but that is a lagging indicator on a lower timeframe—it does not override the higher-timeframe momentum.
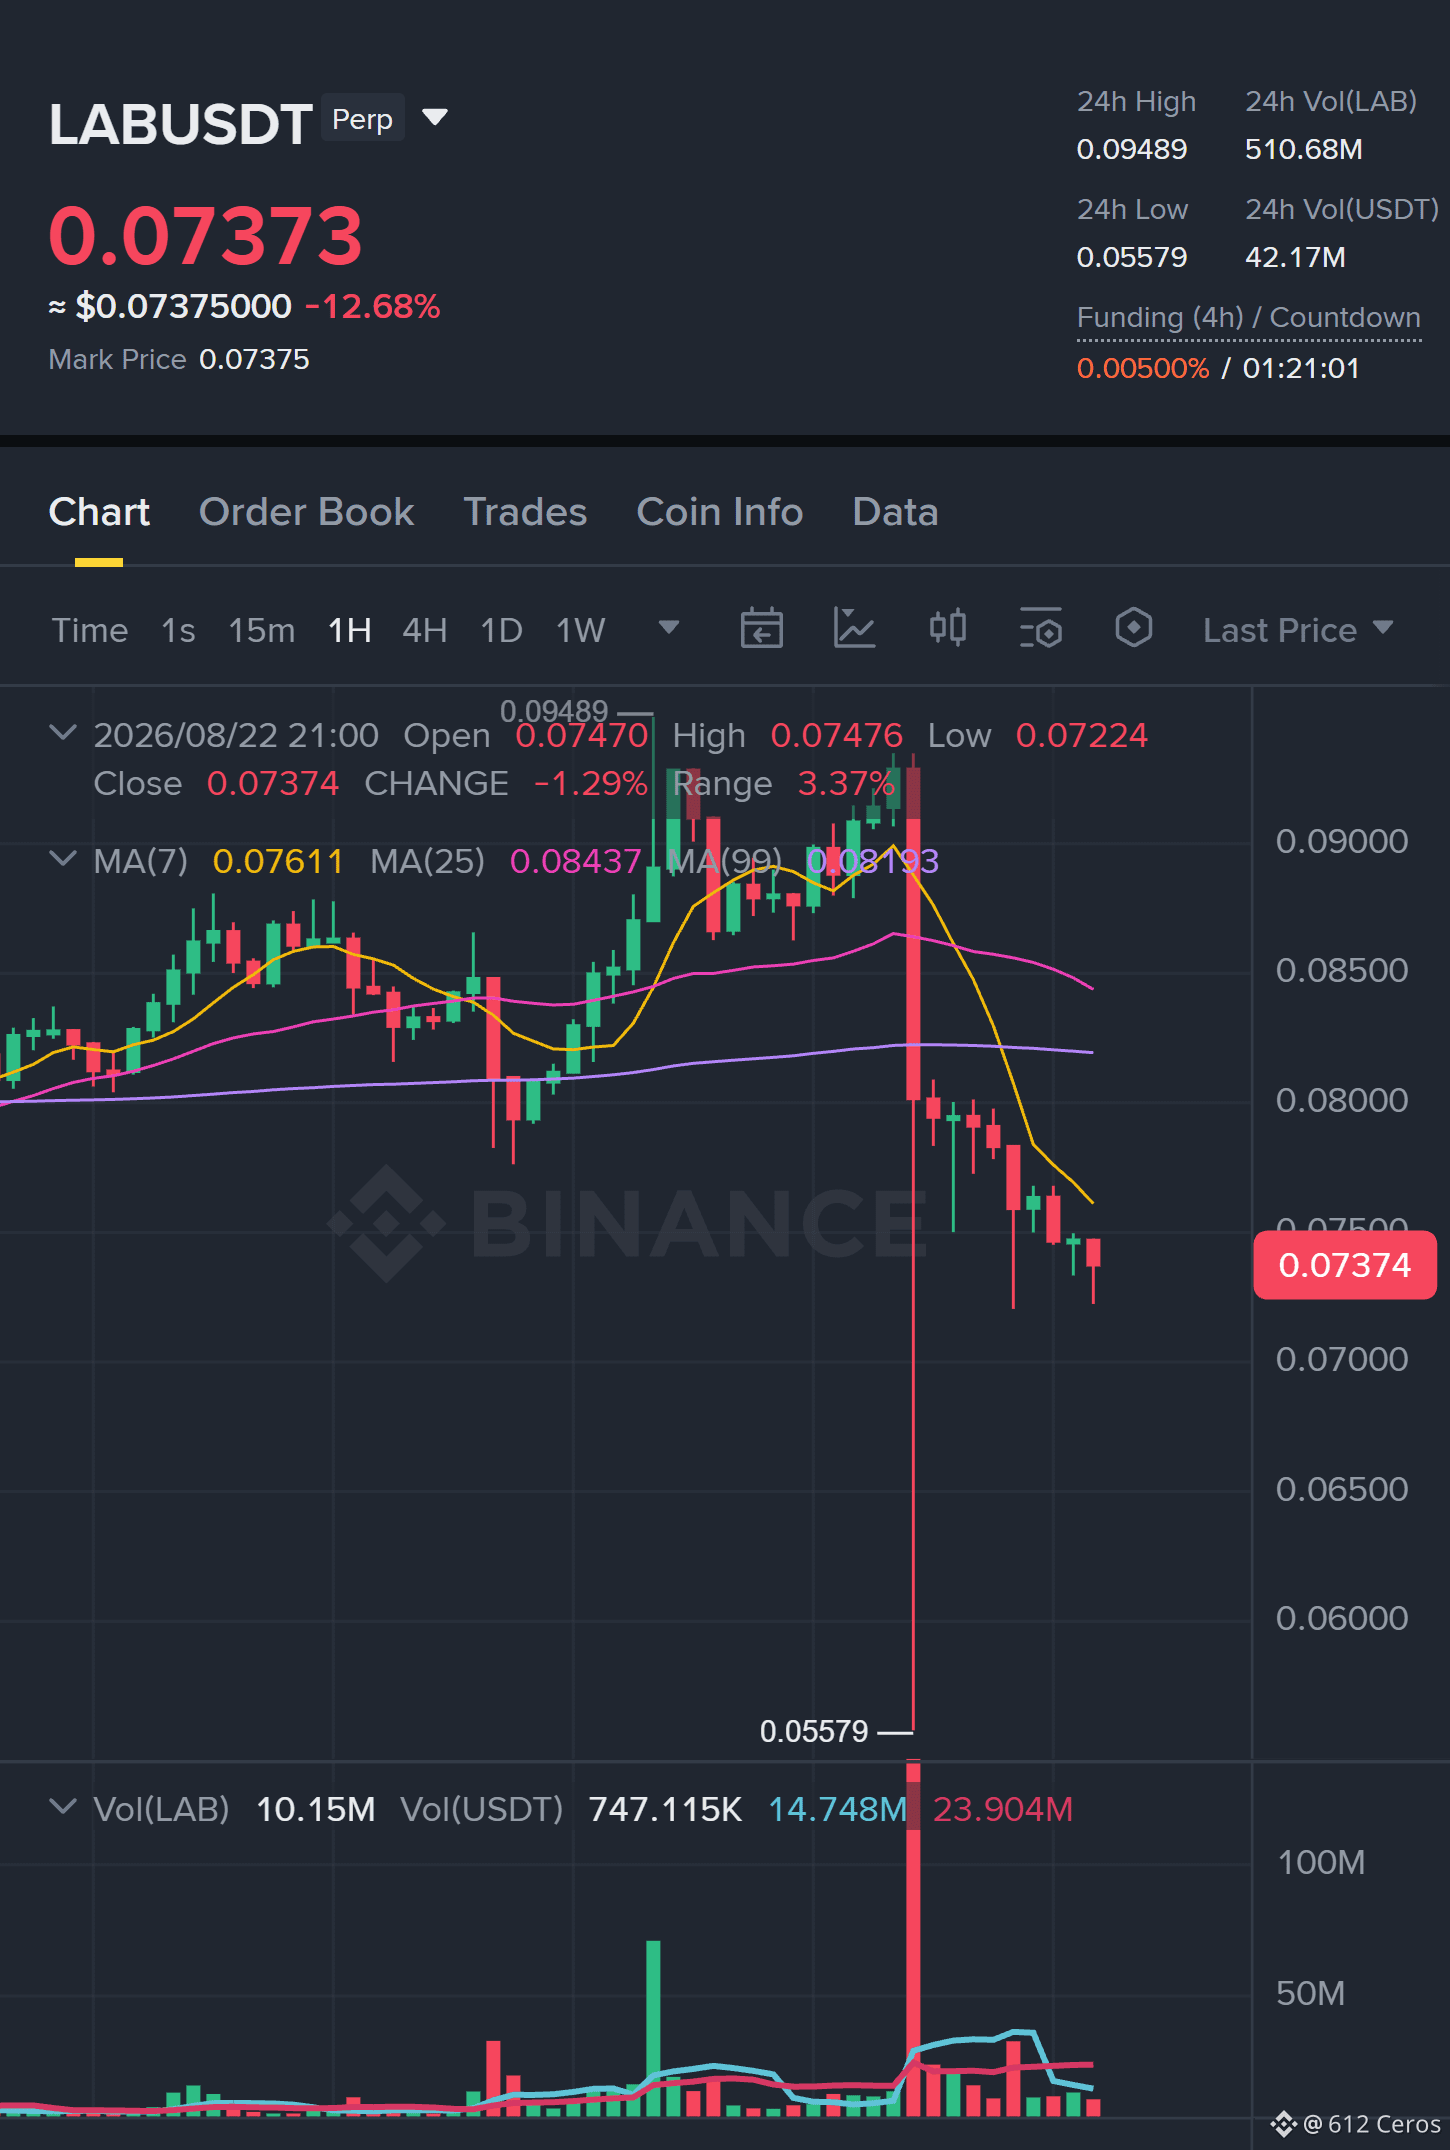
- Current price 0.0738600 is sitting right at the entry reference, with immediate downside targets at 0.0662947 (TP1) and 0.0612511 (TP2).
- The stop loss at 0.0839471 is wide enough to avoid noise but tight enough to cap risk if the trend breaks.
- Why now? The bearish trend is armed with an 88.9 confidence score and a short-side edge of 8.3, meaning the market is paying you to be short, not long.
Debate:
If the 15m RSI screams "buy" but the 4h trend says "sell", which timeframe do you trust with your capital?
Click here to Trade 👇️
$LAB - 🟢 SHORT · Conf 89%
Trade Plan:
Entry: 0.0734907 – 0.0742293
SL: 0.0839471
TP1: 0.0662947
TP2: 0.0612511
TP3: 0.0536858
Why this setup?
- The daily trend is bearish, and the 4h structure confirms we are in a trend regime, not a range.
- The 15m RSI at 29.19 looks "oversold", but that is a lagging indicator on a lower timeframe—it does not override the higher-timeframe momentum.
- Current price 0.0738600 is sitting right at the entry reference, with immediate downside targets at 0.0662947 (TP1) and 0.0612511 (TP2).
- The stop loss at 0.0839471 is wide enough to avoid noise but tight enough to cap risk if the trend breaks.
- Why now? The bearish trend is armed with an 88.9 confidence score and a short-side edge of 8.3, meaning the market is paying you to be short, not long.
Debate:
If the 15m RSI screams "buy" but the 4h trend says "sell", which timeframe do you trust with your capital?
Click here to Trade 👇️