
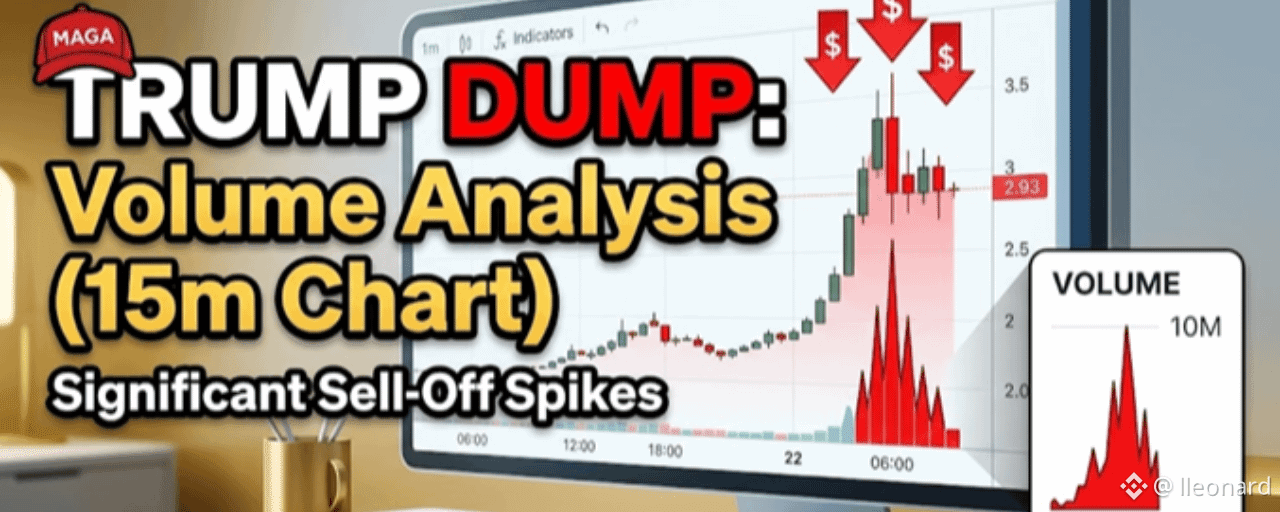
There’s no denying it with a chart like that. The sell-off red candle right after the ~$3.50 pump peak is crystal clear.
15m Chart Analysis
Classic Pump & Dump Pattern: The price surged vertically from the $2.00 mark up to a peak of around $3.53 in just a few candles, immediately followed by long-upper-wick red candles dumping back down.
Massive Sell Volume: The red volume bar near the top spiked to ~10M, drastically outperforming the average volume seen prior. This indicates heavy profit-taking and selling pressure from whales or early buyers dumping onto late buyers.
Current Consolidation: Price is currently hovering around $2.93, but buying volume has dried up significantly (down to ~1.64M).
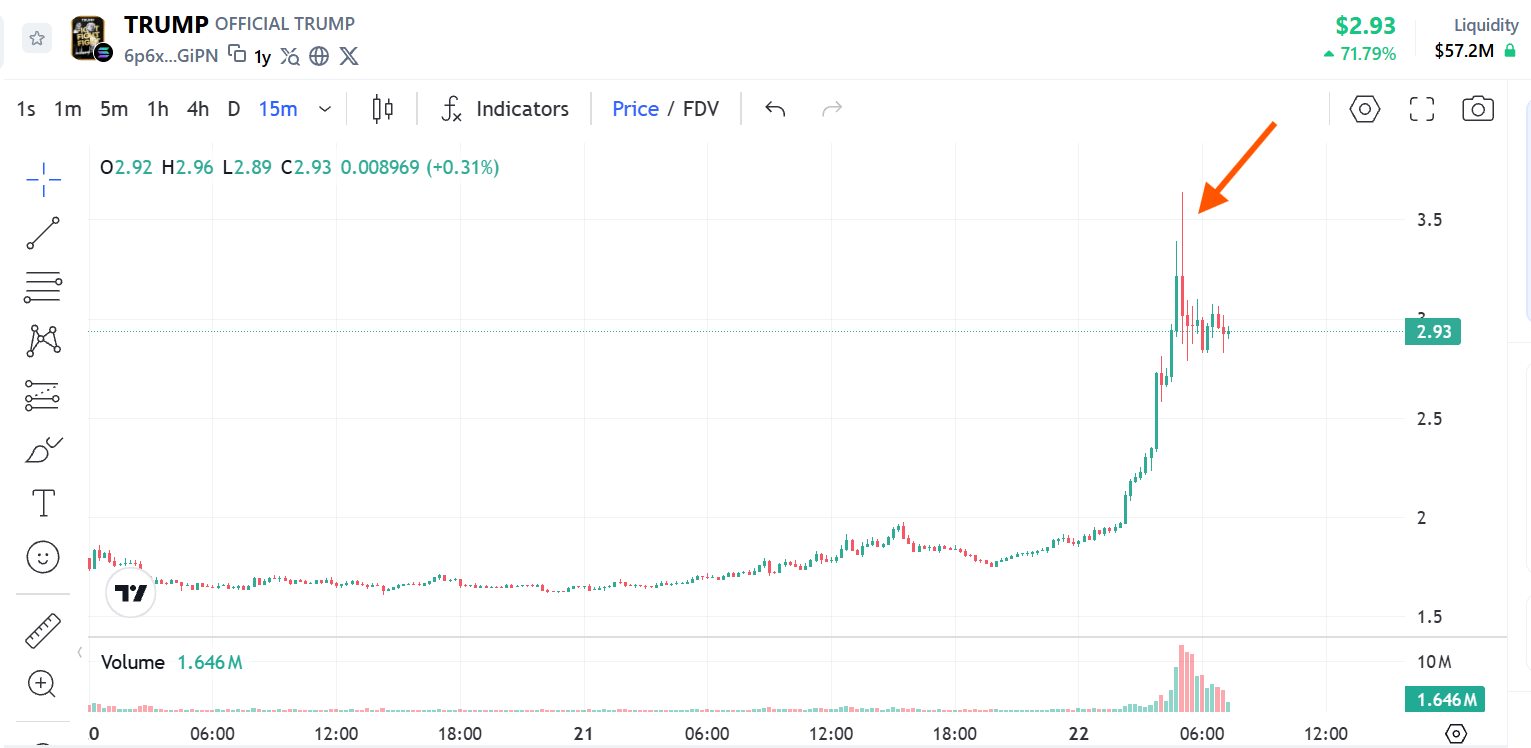
Clear Dump Volume on 15m Chart
Key Takeaways
Wait for Re-accumulation: For volatile news- or hype-driven tokens like TRUMP, a high-volume initial dump often leads to extended sideways movement or further downside if buyers lose interest.
Risk Management: If you are considering catching the knife, it's safer to wait until the price establishes a clear support zone and selling volume completely dries up before taking a position.
