
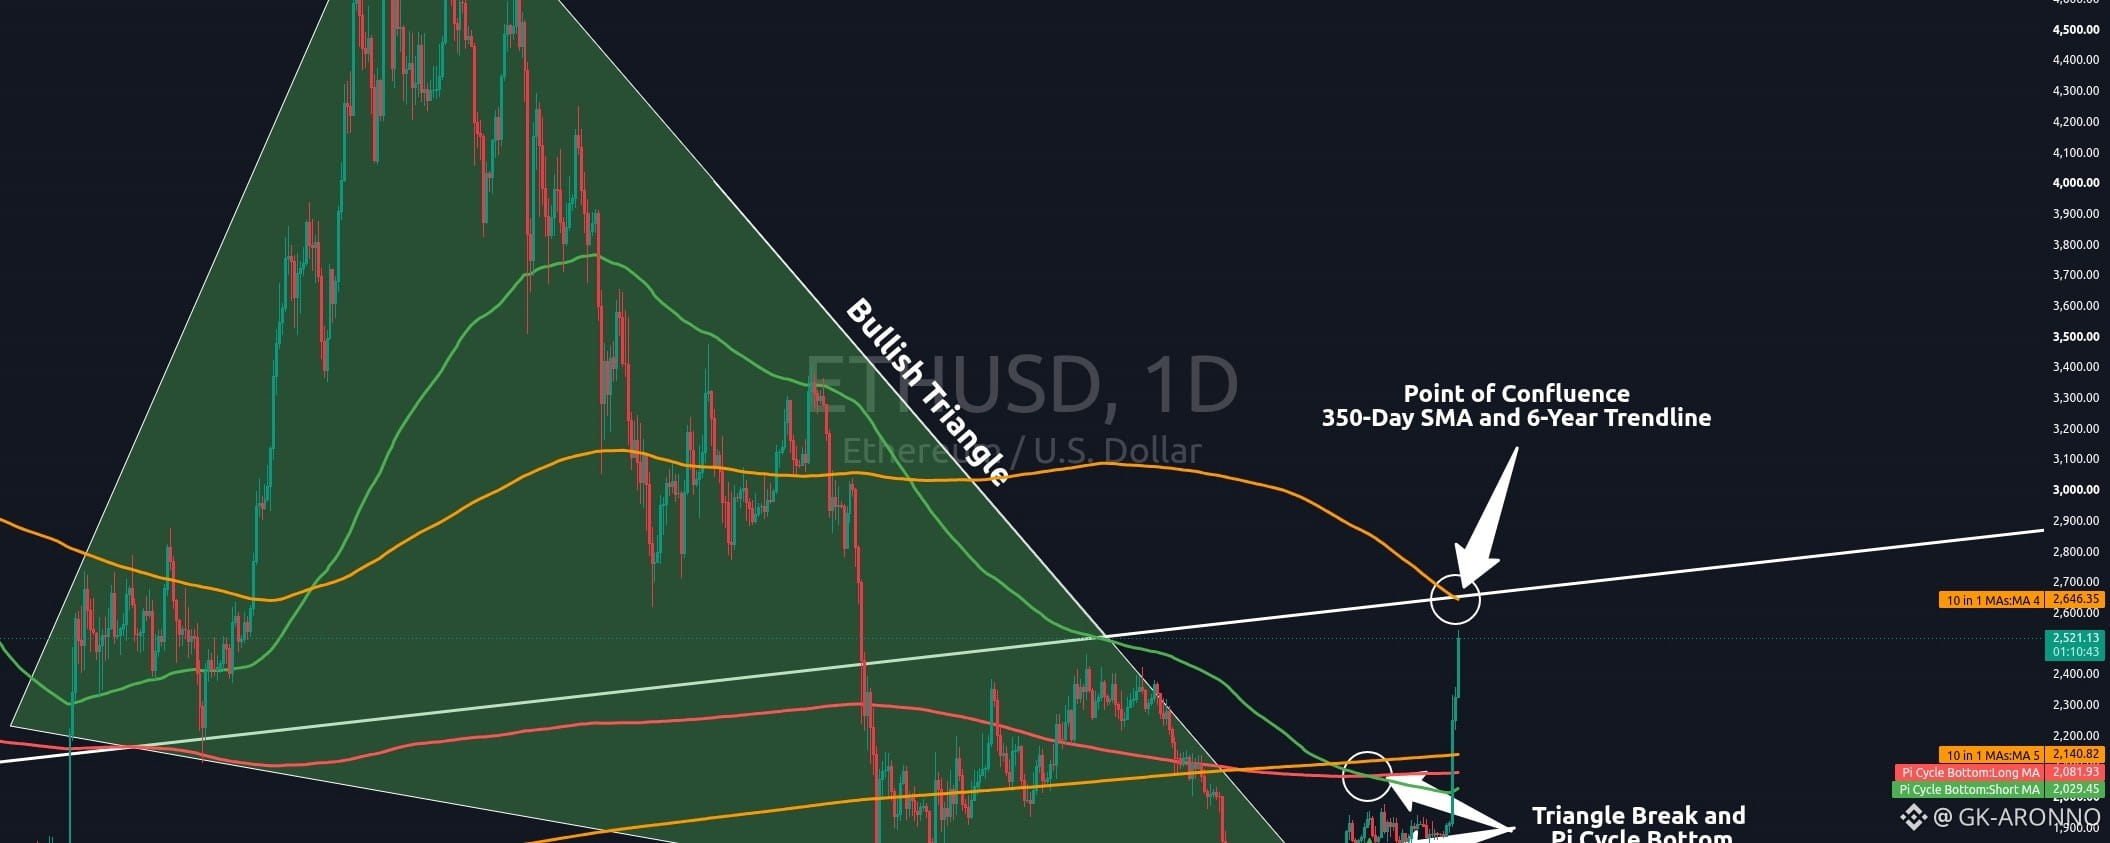

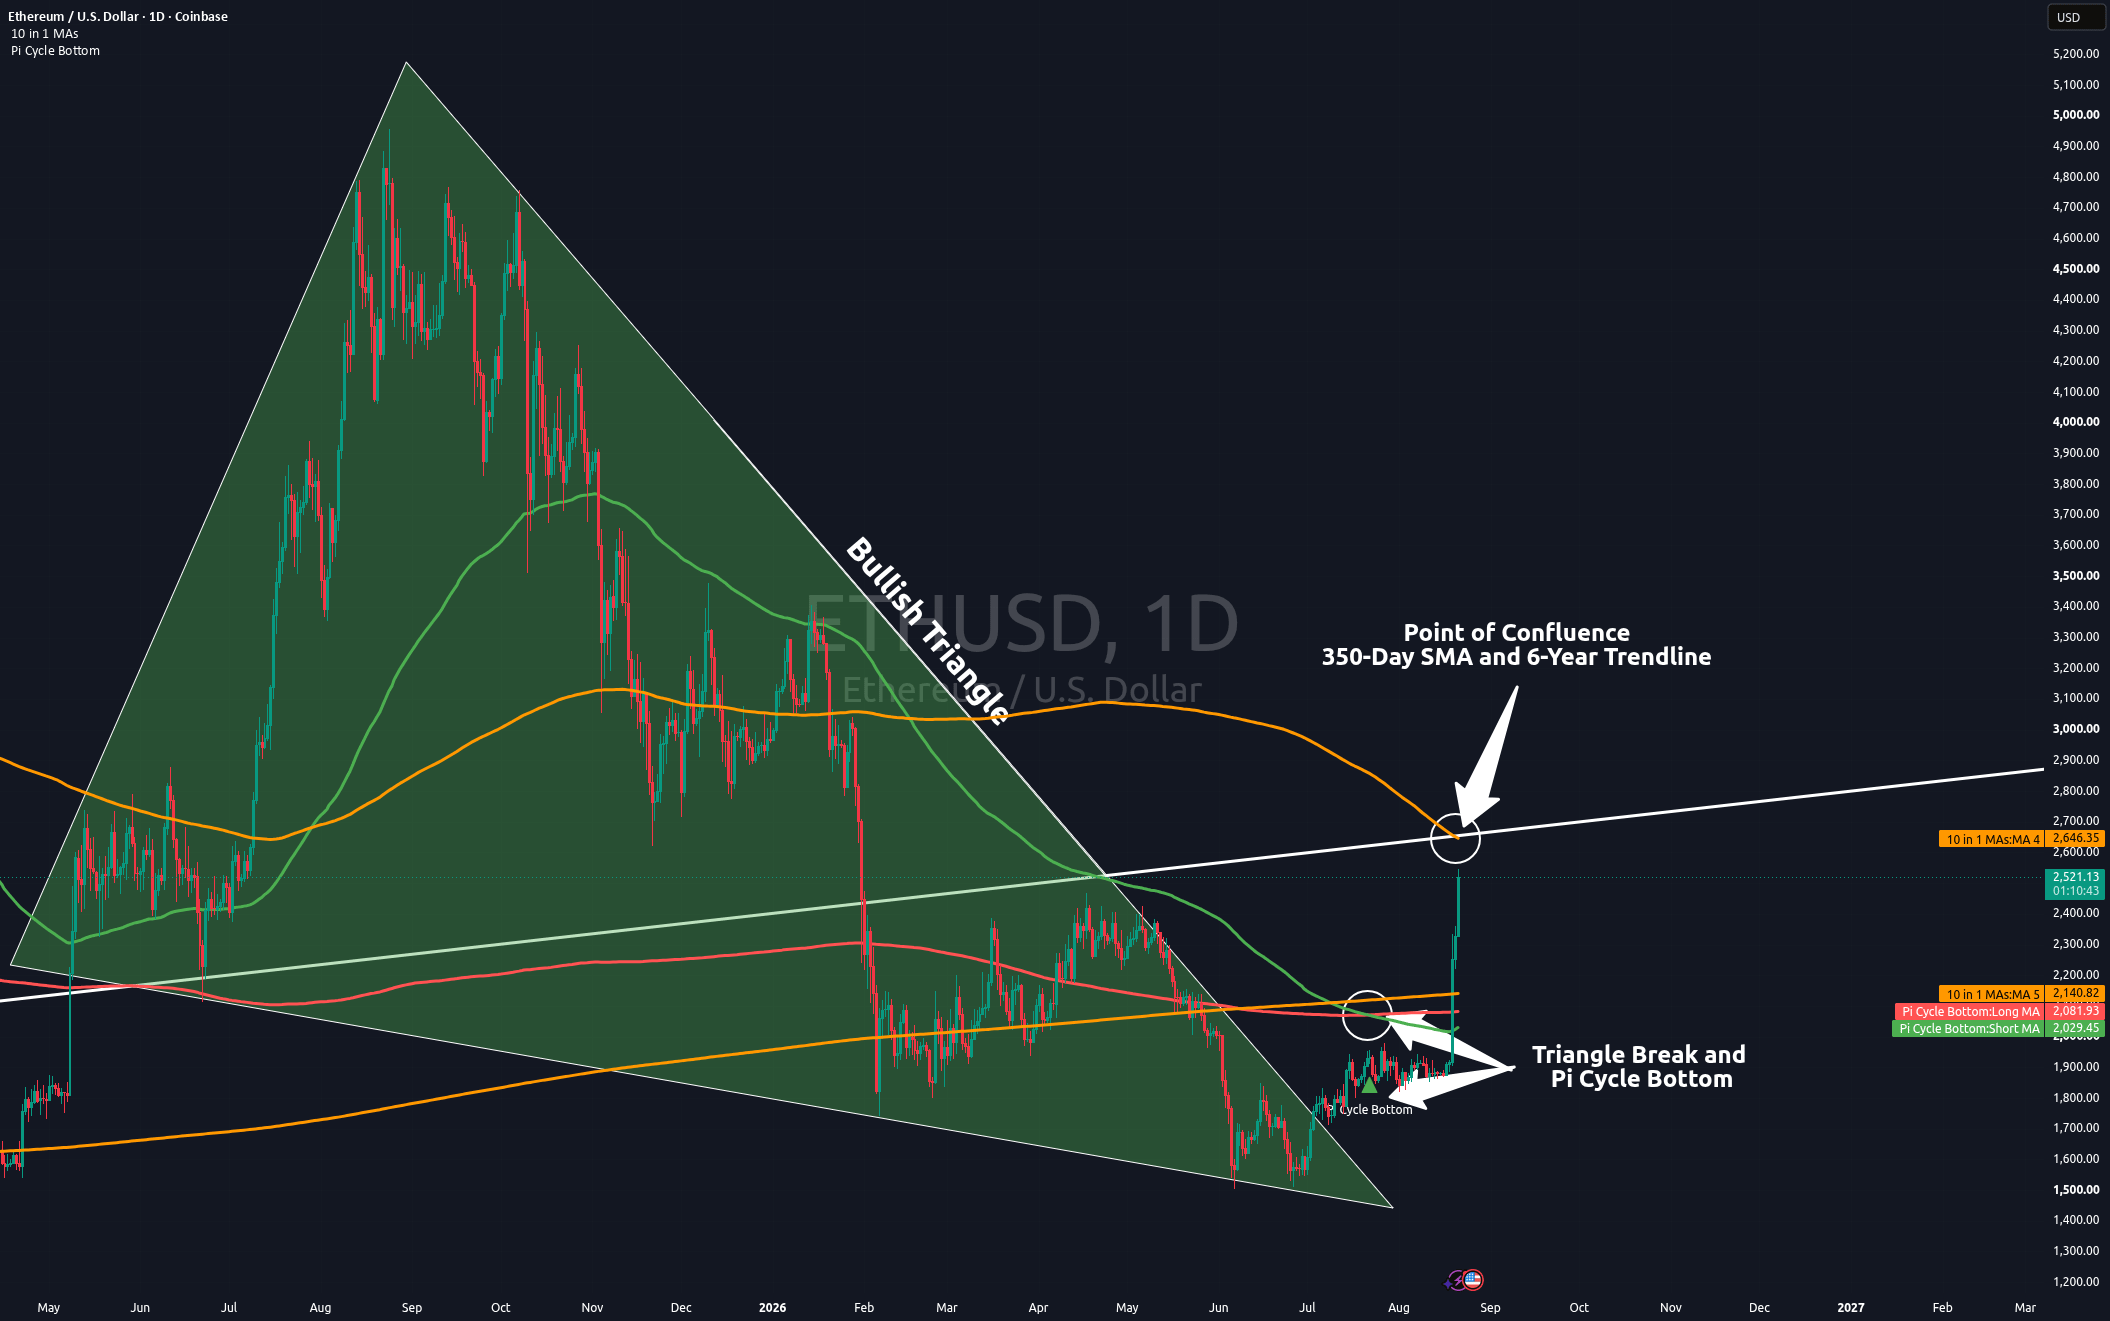
As I mentioned in my previous Bitcoin post, there are a couple of indicators I track closely to follow these longer-term 4-year cycles. One of them is the Pi Cycle Bottom indicator. When the faster-moving 150-day avg. (blue) crosses below the slower-moving 471-day avg. (red), the indicator triggers, and a bottom is likely near. On both Bitcoin and Ethereum, this indicator has always nailed the bottom within weeks or months.
For additional confirmation, I like to see a touch of the 350-week moving avg. (bottom orange). Both have occurred on our Ethereum chart here, and ETH is looking good!
But be cautious with your entries now; we do have serious resistance ahead. Our 350-day SMA is now intersecting a 6-year trendline I have drawn, forming an extremely strong point of confluence overhead.
If I were a betting man (and I am), I would bet we don’t move straight through this. It is likely we hit our heads on this overhead resistance and drop. How far we drop is a guessing game, but I wouldn’t be surprised if we visit the 2000 dollar area one last time before price gains momentum again.
