
15-Minute Chart Analysis | GALA Perpetual Contract (Binance) | August 21, 2026
The Setup
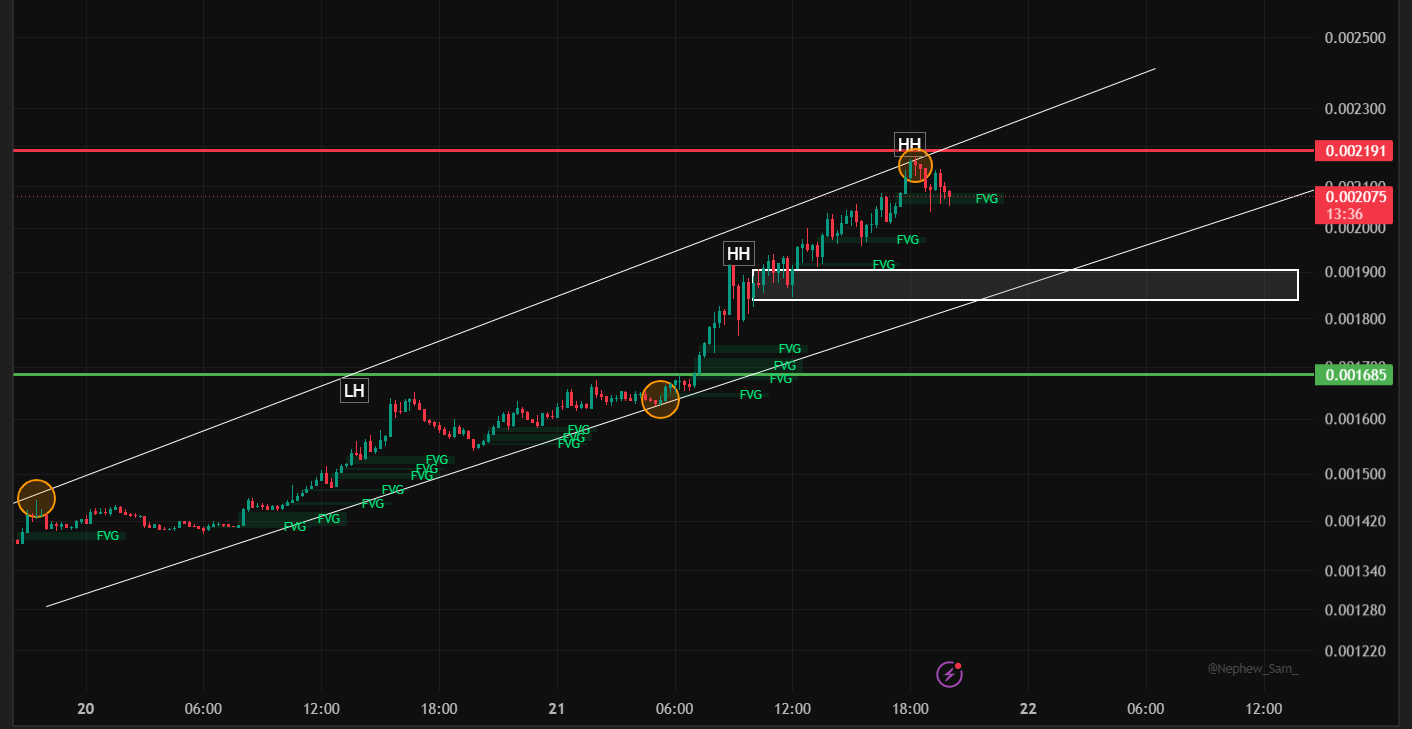
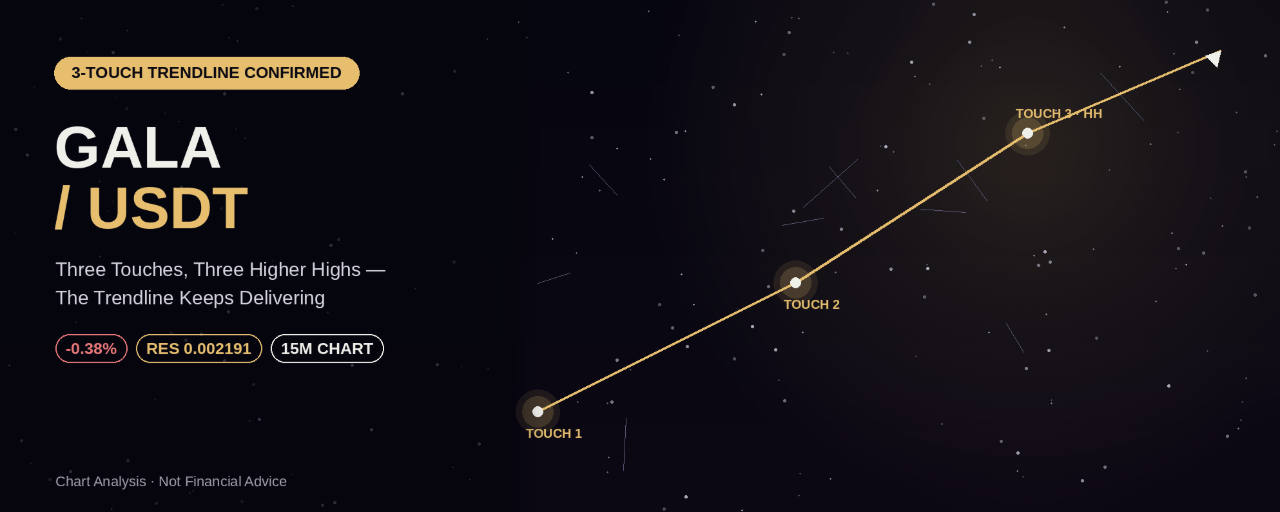
GALA/USDT is running one of the most consistent trending patterns available right now — a single rising trendline that has been tested and respected three separate times, and every single touch has led to a fresh Higher High.
The sequence:
Touch 1: Price based near 0.001420, tapped the rising trendline, and launched into the first leg of the advance.
Along the way, a Lower High (LH) formed near 0.001600 before a shallow pullback.
Touch 2: Price came back down to retest the trendline near 0.001685 (now marked as a green support line) — held perfectly, and launched into a much sharper impulsive leg, breaking through a dense stack of Fair Value Gaps (FVGs) to print the first Higher High near 0.0019.
After a brief consolidation inside a defined range box (roughly 0.00178 – 0.0019), price broke higher again.
Touch 3: The same trendline was tested a third time, this touch coinciding almost exactly with a fresh Higher High at 0.002191 — the current key resistance level.
GALA has since pulled back modestly to 0.002093, down -0.38% on the session, holding inside the FVG zone just below that third-touch high.
Three confirmed touches on the same trendline, each one followed by an expansion to new highs, is about as strong a trend-following signal as a chart can offer. This is not a market chopping sideways — it's one that's been consistently rewarding buyers who trust the line.
Why the Structure Still Favors Buyers
The trendline itself has never been broken — every dip into it has been bought, including the most recent test that lined up directly with the current resistance level.
The 0.001685 support (Touch 2) has held and remains the closest major structural level below current price if this pulls back further than the immediate FVG zone.
The consolidation range box between the first and second Higher Highs (0.00178 – 0.0019) shows healthy, controlled digestion rather than a blow-off top — exactly the kind of pattern that tends to continue.
Current price is holding inside the FVG left behind by the most recent impulsive leg, right where a trend-following buyer would expect support to show up.
Key Levels on the Chart
Resistance above:
0.002191 — the most recent Higher High, tested at Touch 3
Beyond that: the trendline continues projecting toward 0.0023 – 0.0024 over the coming sessions if momentum holds
Support below:
0.00200 – 0.00203 — the FVG zone just below current price, first line of defense on a shallow pullback
0.00178 – 0.0019 — the prior consolidation range, a deeper but still constructive retracement zone
0.001685 — Touch 2 support, the key trendline confirmation level
Below that: a break here would call the entire trendline structure into question
Trade Plan (Educational Framework Only)
🟢 Preferred Long Setup — Buy the FVG/Trendline Zone
Rather than chasing the recent high, the higher-probability entry is on a retracement into the FVG that's sitting just below current price, ideally with confluence from the rising trendline.
Entry zone: 0.00200 – 0.00203 (FVG confluence, shallow pullback)
Deeper entry (better R:R): 0.00178 – 0.0019 (prior consolidation range, if the shallow zone doesn't hold)
Stop loss: Below 0.001685 (a close back below the Touch 2 support and the trendline together)
Target 1: 0.002191 (retest of the recent high)
Target 2: 0.0023 – 0.0024 (trendline projection)
🟡 Breakout Momentum Entry
For traders wanting confirmation before committing:
Entry: A 15-minute close above 0.002191 with continuation
Stop loss: Below 0.00203 (loss of the current FVG structure)
Target 1: 0.0023
Target 2: 0.0024, trailing higher if momentum sustains
🔴 Invalidation
A decisive close below 0.001685 would break the confirmed trendline and put the entire recent structure at risk, shifting the bias back toward neutral.
Bottom Line
GALA/USDT has built one of the cleanest trend-following setups on the board — a rising trendline validated three times, each touch followed by a fresh Higher High. As long as 0.001685 holds, dips into the FVG zone remain buyable, with 0.002191 and then the 0.0023–0.0024 area as the next levels to watch.
⚠️ Disclaimer: This article is for educational and informational purposes only and does not constitute financial advice. Cryptocurrency trading carries significant risk, and GALA/USDT — like most low-cap perpetual contracts — can be highly volatile. Always do your own research (DYOR) and manage risk according to your own financial situation before entering any trade. Past structure and technical patterns do not guarantee future price behavior.
@Binance Square Official #GoldReboundsNearly5% #USRefinersFaceLoomingCrudeSupplyDrop #BitcoinBestWeekSinceMarch2023 #Binance #ChartSniper