

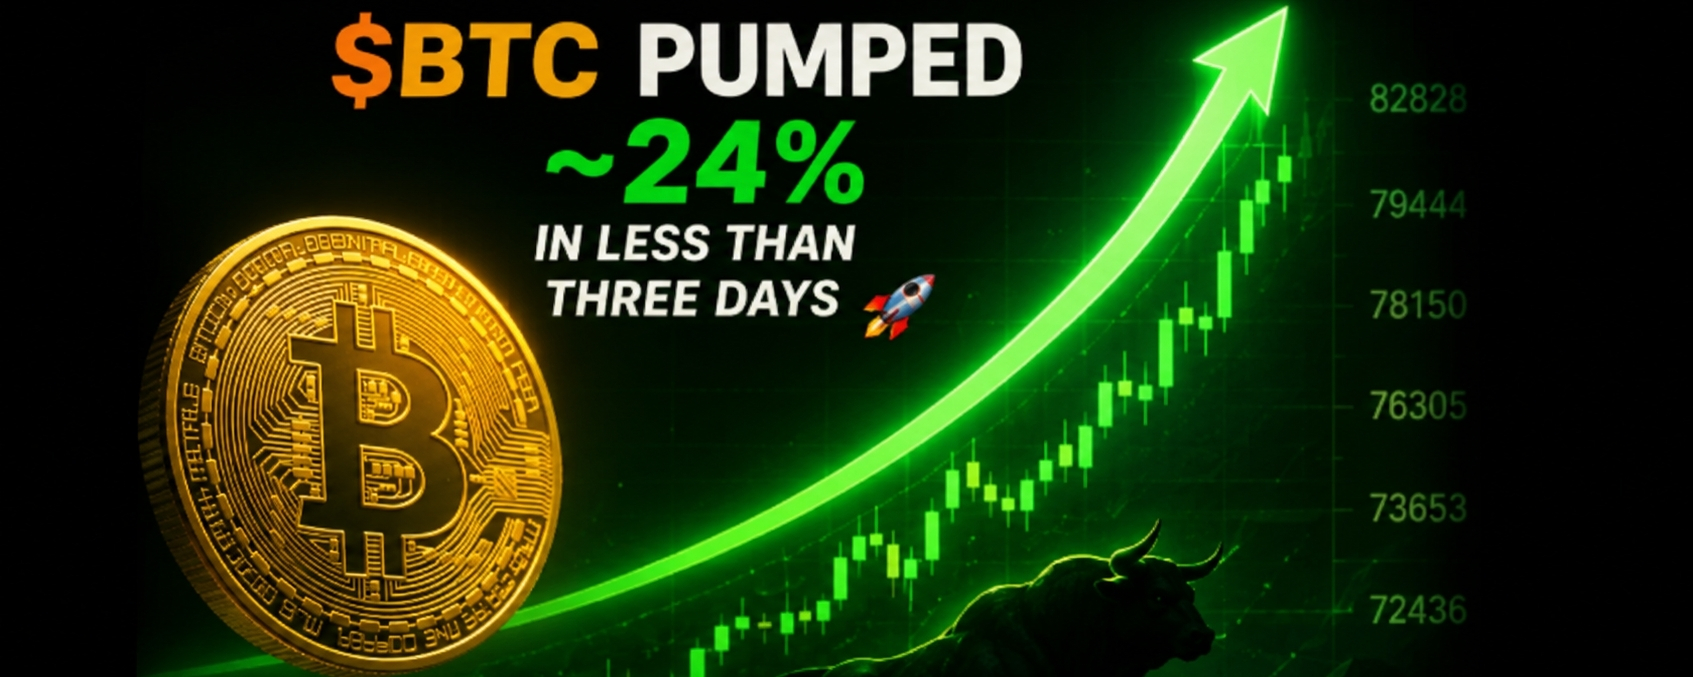

$BTC $BTC لقد ارتفع حوالي 24% في أقل من ثلاثة أيام، وبصراحة، لم أتوقع هذه الحركة بهذا الشكل بسرعة. قبل بضعة أيام، أشك في أن كثيرًا منا كان يتخيل أن البيتكوين سيكون يتداول بالفعل عند هذه المستويات. 🔥
ما زلت أحتفظ بنفس المبلغ الأساسي من البيتكوين الذي كنت أملكه دائمًا. ومع ذلك، تم بيع العملات الإضافية التي اشتريتها قرب 62 ألف–63 ألف دولار للتداول قصير المدى (شراء ثم بيع سريع داخل وخارج) بين 71.5 ألف–71.9 ألف دولار. بالرجوع إلى هذه الحركة الضخمة الآن... نعم، يبدو أن هذا القرار لم يكن ذكيًا جدًا 🤡😂
لكن التداول يعلمنا دروسًا يوميًا. لقد خالفت واحدة من أهم قواعد التداول المربح: دع الفائزين يستمرون.
أدركت أن التعلق الشديد بالأهداف الثابتة يمكن أحيانًا أن يحد من الجانب الصاعد. بدلًا من فرض الأهداف، أعمل على متابعة بنية السوق والتدفق العام. لا توجد توقعات غير ضرورية — فقط تفاعل مع ما يفعله السعر.
📈 هيكل البيتكوين الحالي
في الوقت الحالي، لا يزال البيتكوين يتجه للأعلى على الأطر الزمنية الأقل. على مخططات أقل من ساعة، لم تقم BTC حتى بمحاولة صحيحة لكسر بنية القمة الأعلى / القاع الأعلى (HH/HL).
الشمعة الأخيرة لمدة 30 دقيقة التي دفعت عائدةً إلى ما دون متوسط EMA الشهري 20 هي أول إشارة هبوطية ذات معنى رأيناها منذ بدء هذا الضخ القوي. لكن إشارة واحدة وحدها لا تؤكد انعكاسًا — ما زلنا بحاجة إلى الانتظار ومعرفة كيف سيتصرف السعر. 👀
🎯 أقرب مستويات رئيسية
⬆️ أعلى:
78,150 / 79,444 / 82,828
⬇️ أسفل:
76,305 / 73,653 / 72,436
الزخم ما زال مثيرًا للإعجاب، لكن بعد هذه الحركة الكبيرة خلال وقت قصير، قد ترتفع التقلبات بسرعة. أنا أراقب البنية عن كثب بدلًا من التسرّع في تقديم توقعات.
لنرَ ما إذا كان $BTC BTC يستمر في مسيرته الانفجارية أو يمنحنا في النهاية تراجعًا أعمق. 🚀🔥