
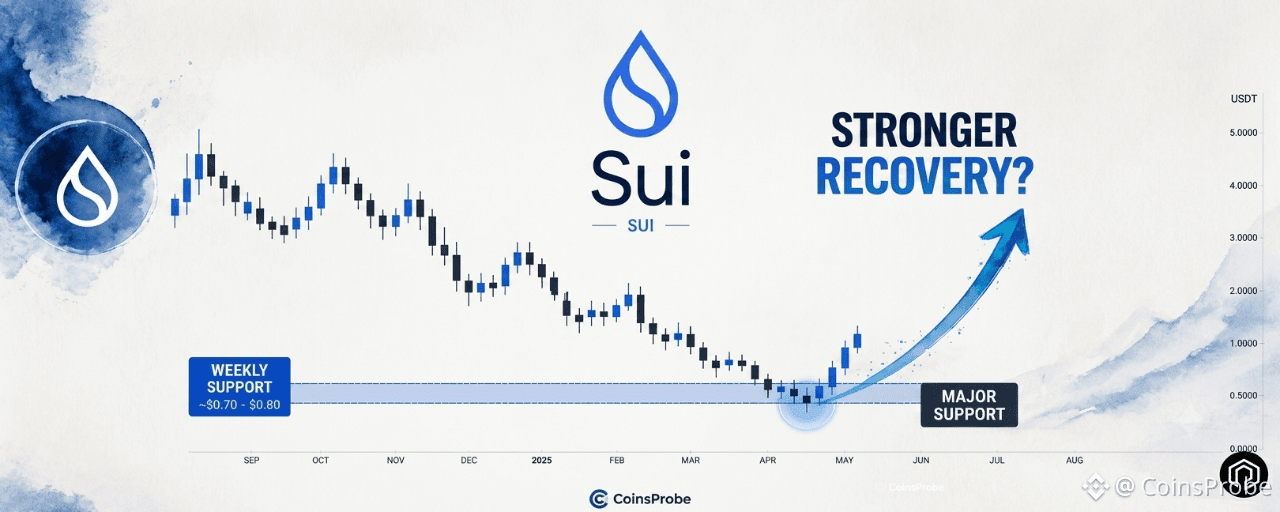

Key Highlights
SUI is trading at $0.7830 — up 8.24% in 24 hours and 3.27% over 30 days — bouncing off a multi-year ascending support trendline that has held every major correction since 2023.
A bullish RSI divergence has formed on the weekly chart — price printing lower lows while RSI prints higher lows — a classic signal that selling pressure is exhausting.
Bitcoin is up approximately 24% over 7 days above $78,000 and Ethereum is up nearly 28% toward $2,400 — providing the strongest macro tailwind SUI has had in 2026.
Sui ($SUI) is producing one of the more technically defined setups in the current altcoin recovery — bouncing from a major weekly support trendline at the exact moment the broader crypto market is delivering its strongest 7-day performance of 2026. The combination of a macro tailwind and a chart structure that has been building since 2023 is drawing significant attention from technical traders.
At the time of writing, SUI is trading at $0.7830 — up 8.24% in 24 hours and 3.27% over the past 30 days — with a market capitalization of approximately $3.19 billion. The weekly candle is attempting to close as a decisive bounce from what analyst @CryptoBullet1 identifies as the most important long-term support level on SUI’s chart.

SUI Price on 21 Aug 2026 | Source: Coinmarketcap
The Macro Context — Bitcoin and Ethereum Leading the Strongest Rally of 2026
Before examining SUI’s specific technical setup, the macro backdrop deserves acknowledgment — because the environment SUI is bouncing in is materially different from the conditions that defined most of 2026.
Bitcoin is up approximately 24% over 7 days, trading above $78,000 — a move fueled by the U.S. Treasury doubling long-end bond buybacks, President Trump’s White House crypto summit declaring “the war on crypto is over,” and $2.74 billion in short liquidations that produced one of the 8th largest forced-sell events in crypto history.
Ethereum is up nearly 28% over 7 days, approaching the $2,400 level — with the 18.16% single-session surge on August 19 representing one of ETH’s strongest individual daily advances in recent cycle history.
This is the risk-on environment into which SUI’s weekly chart is delivering its support bounce. The significance of the technical setup is amplified — not created — by the macro context. The support trendline was going to be tested regardless of what Bitcoin and Ethereum did. The fact that it is being tested during one of the strongest macro tailwind environments of 2026 increases the probability that the bounce sustains.
Weekly Chart Analysis — Multi-Year Support Holds Again
The technical foundation of the current SUI setup is a multi-year ascending support trendline visible on the weekly chart — a rising line of support that has connected the major corrective lows since mid-2023 and has been tested and held multiple times across the full cycle.
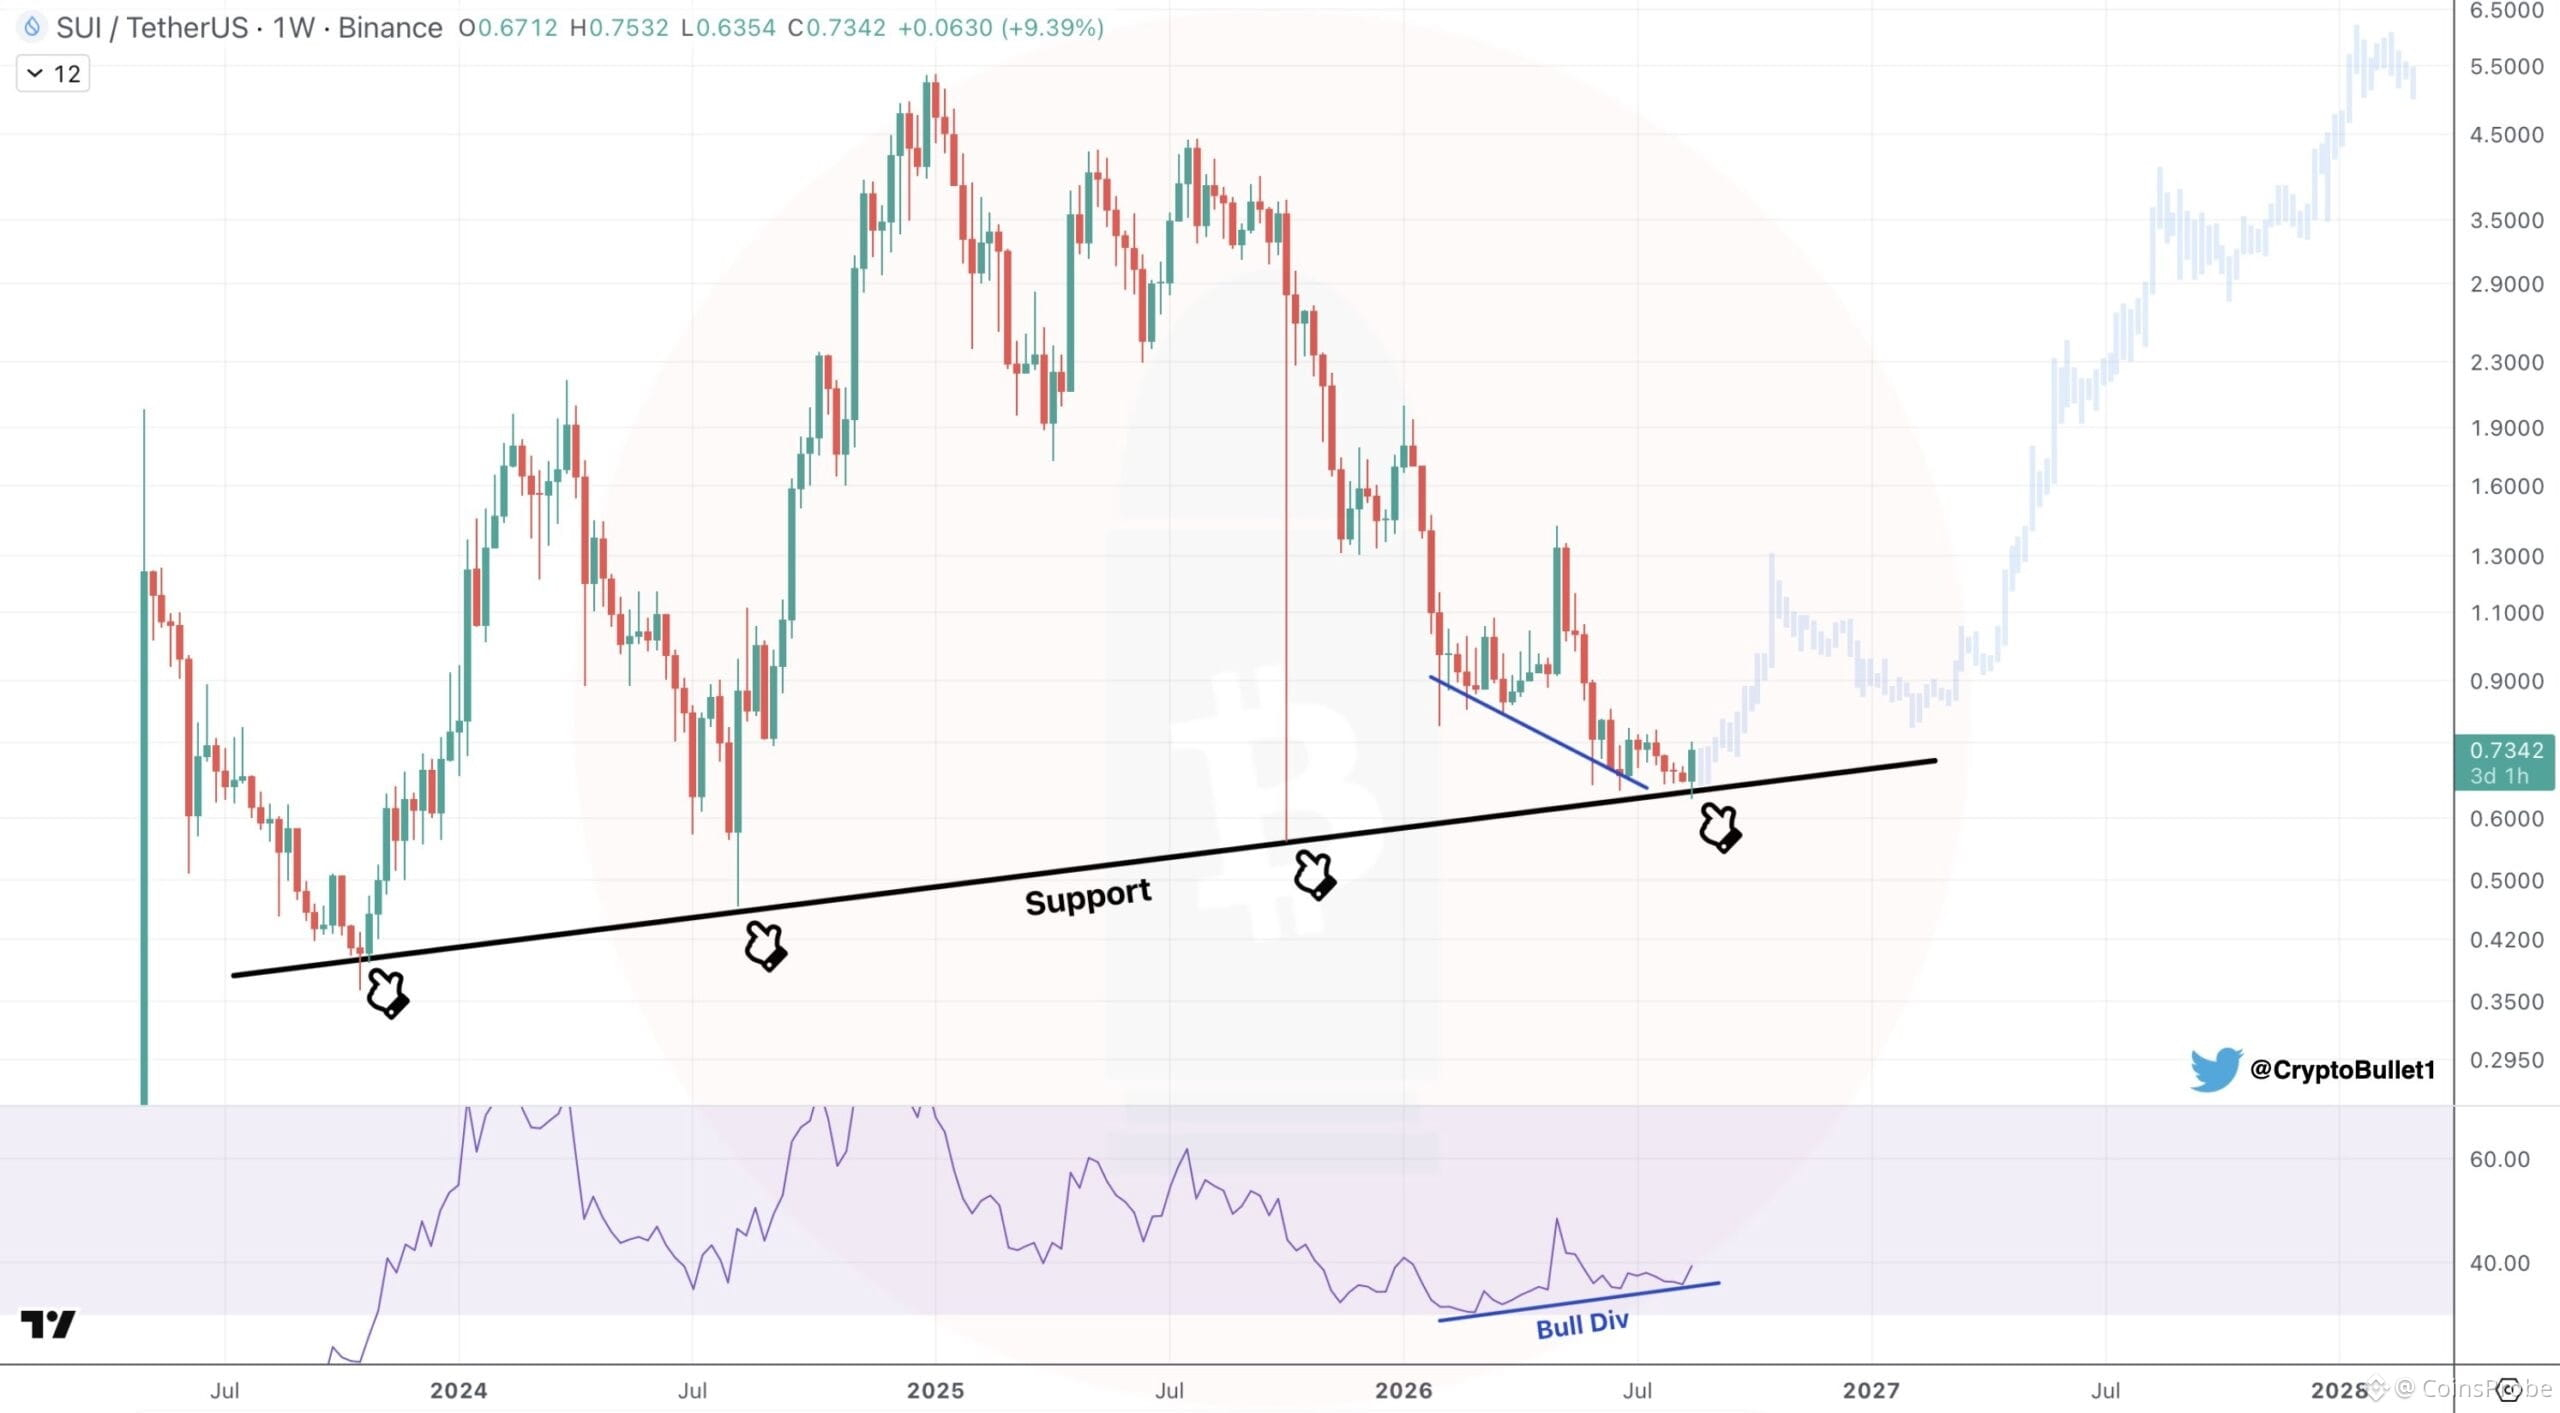
SUI Weekly Chart/Source: @CryptoBullet1 (X)
The Support Trendline — Four Tests, Four Holds
The weekly chart shows four clearly identifiable touches of the ascending support line — marked with hand cursor icons by @CryptoBullet1 — at progressively higher price levels across 2023, 2024, 2025, and now 2026:
Test Approximate Period Approximate Support Level1st TouchMid-2023~$0.35–$0.40 zone2nd Touch Early 2024~$0.42–$0.45 zone3rd TouchMid-2025~$0.50–$0.55 zone4th Touch August 2026~$0.60–$0.65 zone
Each prior test of this trendline was followed by a significant recovery — with the most notable being the 2024 bounce that eventually carried SUI to its all-time high above $5.00. The current 4th test is now producing a weekly bounce with the same structural characteristics as the prior three.
A trendline that has held four consecutive tests across more than three years of cycle history is not a casual technical observation — it is the defining structural feature of SUI’s long-term price architecture, and its continued validity is the central thesis of the current bullish setup.
Bullish RSI Divergence — The Key Confirmation Signal
The most analytically significant element of @CryptoBullet1’s chart is not the support trendline itself — it is what the RSI is doing in the lower panel while price tests that support.
A bullish RSI divergence has formed on the weekly chart:
Price action: Making lower lows — SUI’s corrective phase from the 2025 ATH has been producing successive lower price lows
RSI reading: Making higher lows — while price declined to new corrective lows, the RSI has been printing progressively higher readings at each successive low
This divergence — price lower, RSI higher — is one of the most classically documented reversal signals in technical analysis. It indicates that selling pressure is weakening at each successive price low — fewer sellers are participating in the decline, even as price makes new corrective lows. The momentum behind the downtrend is deteriorating.
Bullish RSI divergences on weekly charts — which represent a multi-month development rather than a single-session reading — carry substantially more analytical weight than the same pattern on shorter timeframes. The current weekly RSI divergence on SUI, coinciding with the 4th test of the multi-year ascending support, creates a technical combination that has historically preceded significant recoveries in assets that have these structural characteristics.
The chart also shows a descending resistance line (blue line) on the recent price action — a short-term downtrend that price is now breaking above, adding further momentum confirmation to the support bounce.
What the Chart Projects — The Medium to Long-Term Path
The weekly chart shared by @CryptoBullet1 includes a projected price path (shown in light blue/cyan shading) — illustrating the expected trajectory if the support continues to hold and the bullish RSI divergence plays out.
The projection suggests:
Near-term: Sustained hold above the $0.60 trendline support, with initial recovery toward the $1.00–$1.30 range as the immediate resistance cluster from the prior consolidation phase.
Medium-term: A recovery toward the $2.00–$3.00 range as the prior cycle’s support/resistance levels are tested from below.
Longer-term: If the full bullish structure plays out — support holds, RSI divergence resolves, and macro conditions remain constructive — the chart projection points toward $4.50–$5.50+ as the longer-term target, consistent with a retest of SUI’s all-time high zone.
These are projected paths, not guaranteed outcomes — the chart clearly delineates the support level below which the entire structure fails.
Bullish vs. Bearish Scenarios
Bullish Scenario
SUI holds the ascending weekly support trendline on a sustained closing basis — current price at $0.7830 remaining above the ~$0.60 support floor. The weekly RSI divergence resolves to the upside as buying pressure returns and momentum improves. The macro backdrop (Bitcoin above $78,000, Ethereum near $2,400, improving regulatory environment post-Trump White House summit) continues providing the risk-on tailwind. In this scenario, the initial recovery target is $1.00–$1.30, followed by the medium-term path toward $2.00–$3.00 and the longer-term potential retest of the $5.00+ ATH zone — mirroring the trajectory that followed the three prior trendline touches.
Bearish Scenario
A decisive weekly close below the ascending support trendline — specifically a sustained close below approximately $0.60 — would break the multi-year structural support and invalidate the bullish thesis. In this scenario, lower support levels in the $0.40–$0.50 range become the next reference points. The bullish RSI divergence would also be invalidated by a sustained break below the prior RSI lows. This scenario would require either a significant macro reversal or SUI-specific selling pressure that overcomes the trendline support even in a positive macro environment.
Bottom Line
Sui ($SUI) is at a technically precise and historically validated decision point. The 4th test of a multi-year ascending weekly support trendline that has held since 2023, combined with a bullish RSI divergence signaling weakening selling pressure, and the strongest macro tailwind of 2026 in Bitcoin’s 24% 7-day surge and Ethereum’s 28% recovery — these elements have converged simultaneously at the current $0.7830 price level.
The setup is defined. The support is clear at $0.60. The RSI divergence is confirmed on the weekly. The invalidation level is specific and testable.
Whether the current weekly bounce builds into the recovery that the trendline structure and RSI divergence are projecting, or whether macro conditions shift and the support eventually fails, will be determined by how SUI’s weekly candles close over the coming sessions. But the technical case for the current bounce — built on four trendline touches across three years and a weekly RSI divergence — is among the more structurally grounded setups in the altcoin market at the time of writing.
Disclaimer: The views and analysis presented in this article are for informational purposes only and reflect the author’s perspective, not financial advice. Technical patterns and indicators discussed are subject to market volatility and may or may not yield anticipated results. Investors are advised to exercise caution, conduct independent research, and make decisions aligned with their individual risk tolerance.