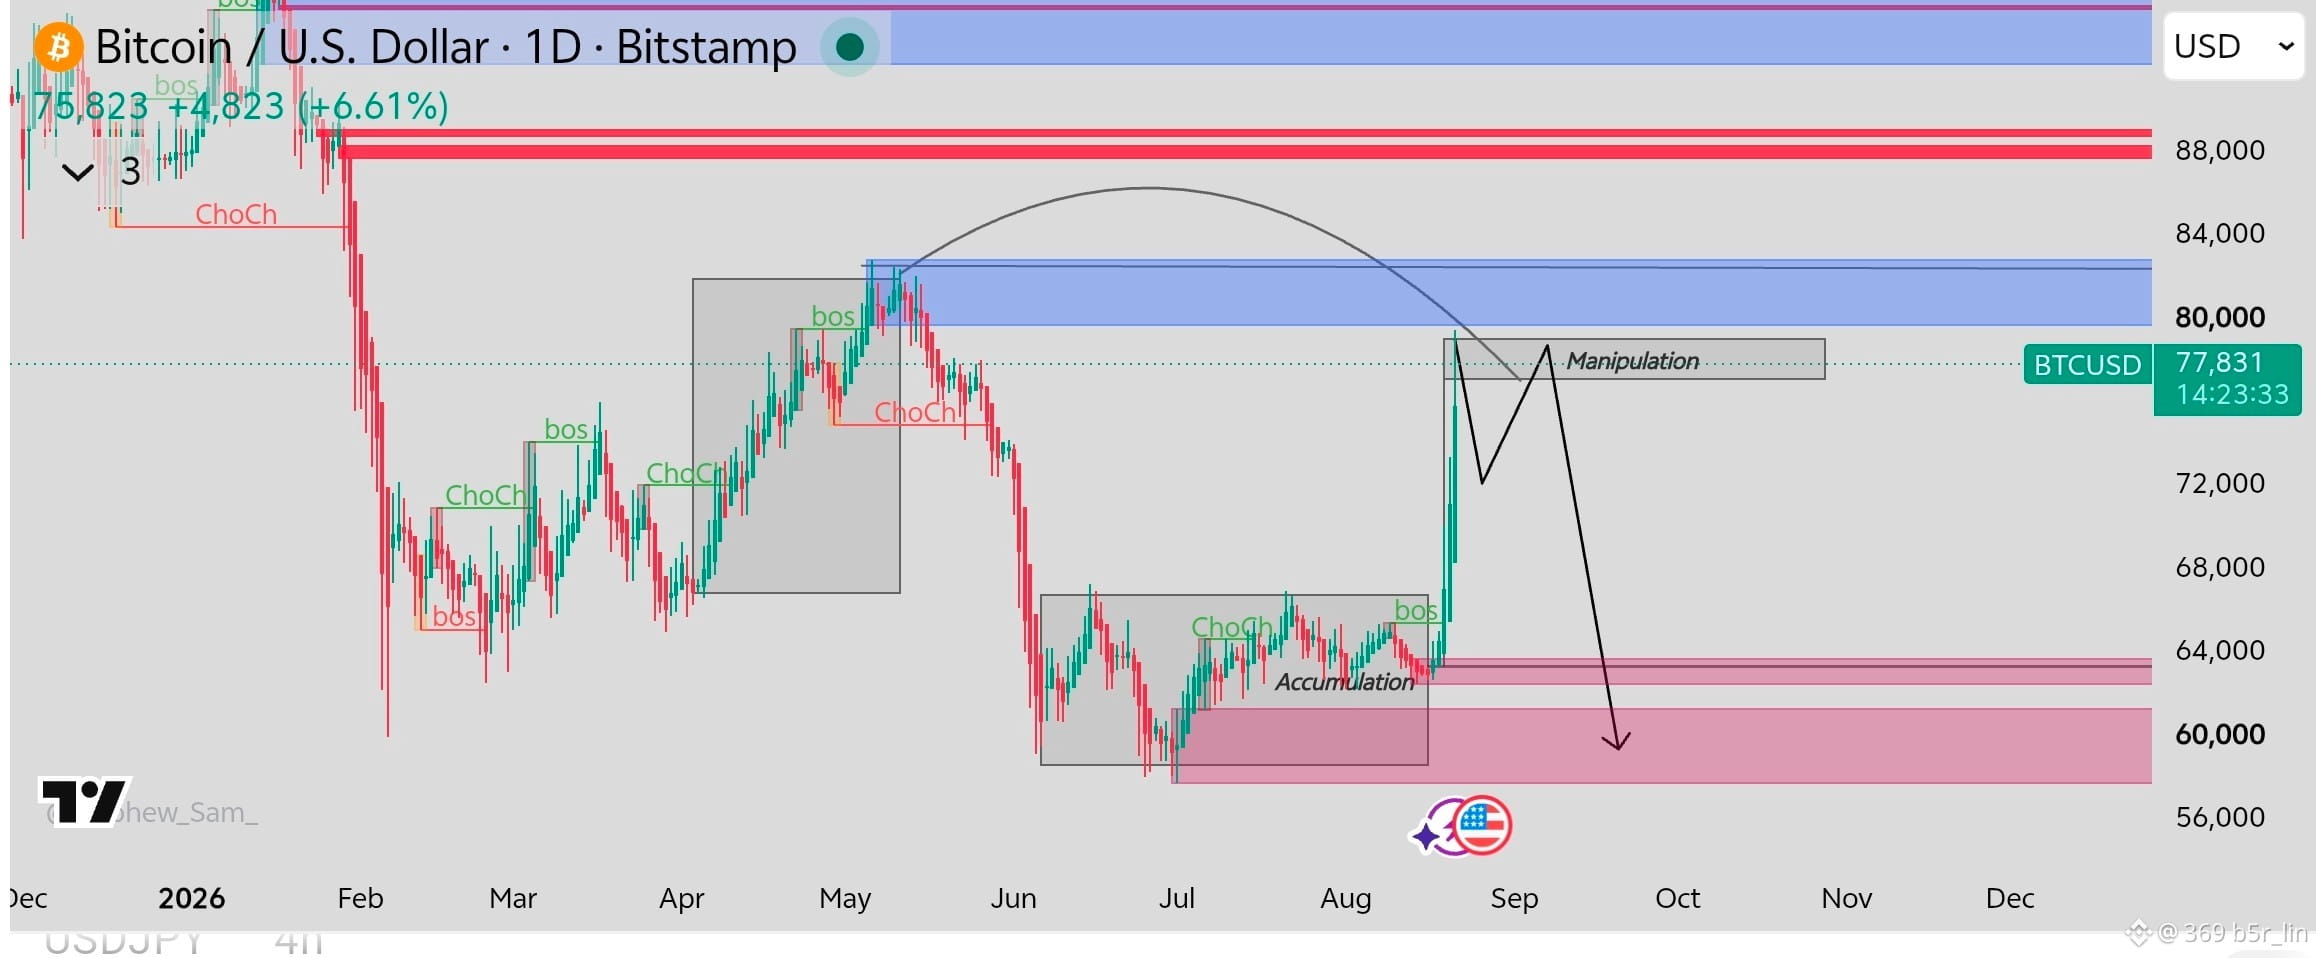
$BTC chart 📉 show AMD Concept
I'd divide it into two scenarios:
🔴 SHORT SETUP
$78K–$83K rejection
Liquidity sweep → bearish CHoCH → retest → SHORT
Targets:
72K → 68K → 64K → 60K
🟢 LONG SETUP
Daily/4H acceptance above $83K
Breakout → retest → bullish BOS → LONG
First major target: $88k to $ 90k
Most important AMD rule :📚
Don't predict the manipulation. Trade the confirmation after it happens.
A lot of traders see "$78K = manipulation" and immediately short. That's dangerous.
The cleaner AMD trade is:
Accumulation ✅ → Manipulation/Sweep ✅ → Structure shift ✅ → Retest ✅ → Distribution trade
For this chart, $78K–$83K is the decision zone, while $63K–$65K is the major downside reaction zone.
If BTC is currently around the $77.8K shown on your chart, I'd wait for the liquidity sweep + CHoCH rather than entering blindly.
I'd divide it into two scenarios:
🔴 SHORT SETUP
$78K–$83K rejection
Liquidity sweep → bearish CHoCH → retest → SHORT
Targets:
72K → 68K → 64K → 60K
🟢 LONG SETUP
Daily/4H acceptance above $83K
Breakout → retest → bullish BOS → LONG
First major target: $88k to $ 90k
Most important AMD rule :📚
Don't predict the manipulation. Trade the confirmation after it happens.
A lot of traders see "$78K = manipulation" and immediately short. That's dangerous.
The cleaner AMD trade is:
Accumulation ✅ → Manipulation/Sweep ✅ → Structure shift ✅ → Retest ✅ → Distribution trade
For this chart, $78K–$83K is the decision zone, while $63K–$65K is the major downside reaction zone.
If BTC is currently around the $77.8K shown on your chart, I'd wait for the liquidity sweep + CHoCH rather than entering blindly.