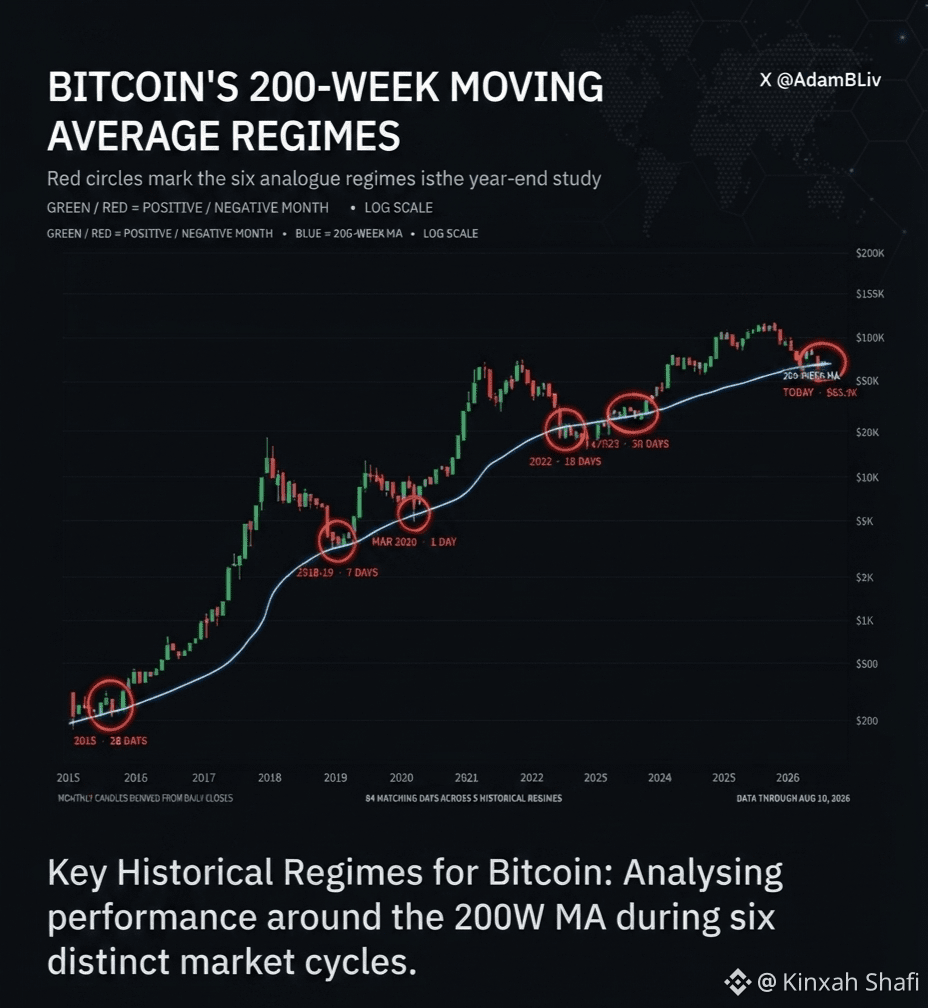
🚨 BTC 200-WEEK MOVING AVERAGE ALERT! 📈
$BTC
Bitcoin is testing its ultimate historical line in the sand—the 200-Week Moving Average (MA)!
🔍 Why This Matters:
Historical Floor: Historically, dipping near or below the 200-week MA (blue line) marks absolute macro cyclical bottoms (2015, 2018, 2020, 2022).
Rare Accumulation Zone: These red circles show rare regimes where BTC tests this line before massive bull expansions.
Current Status: Today we are sitting right on this crucial macro support line around $63.9K.
💡 Conclusion:
This is historically one of the safest high-timeframe accumulation zones for long-term spot investors. Watch the weekly close closely! 🛡️⏳
#BTC #Bitcoin #CryptoAnalysis #TechnicalAnalysis #200WMA #BinanceSquare
$BTC
Bitcoin is testing its ultimate historical line in the sand—the 200-Week Moving Average (MA)!
🔍 Why This Matters:
Historical Floor: Historically, dipping near or below the 200-week MA (blue line) marks absolute macro cyclical bottoms (2015, 2018, 2020, 2022).
Rare Accumulation Zone: These red circles show rare regimes where BTC tests this line before massive bull expansions.
Current Status: Today we are sitting right on this crucial macro support line around $63.9K.
💡 Conclusion:
This is historically one of the safest high-timeframe accumulation zones for long-term spot investors. Watch the weekly close closely! 🛡️⏳
#BTC #Bitcoin #CryptoAnalysis #TechnicalAnalysis #200WMA #BinanceSquare