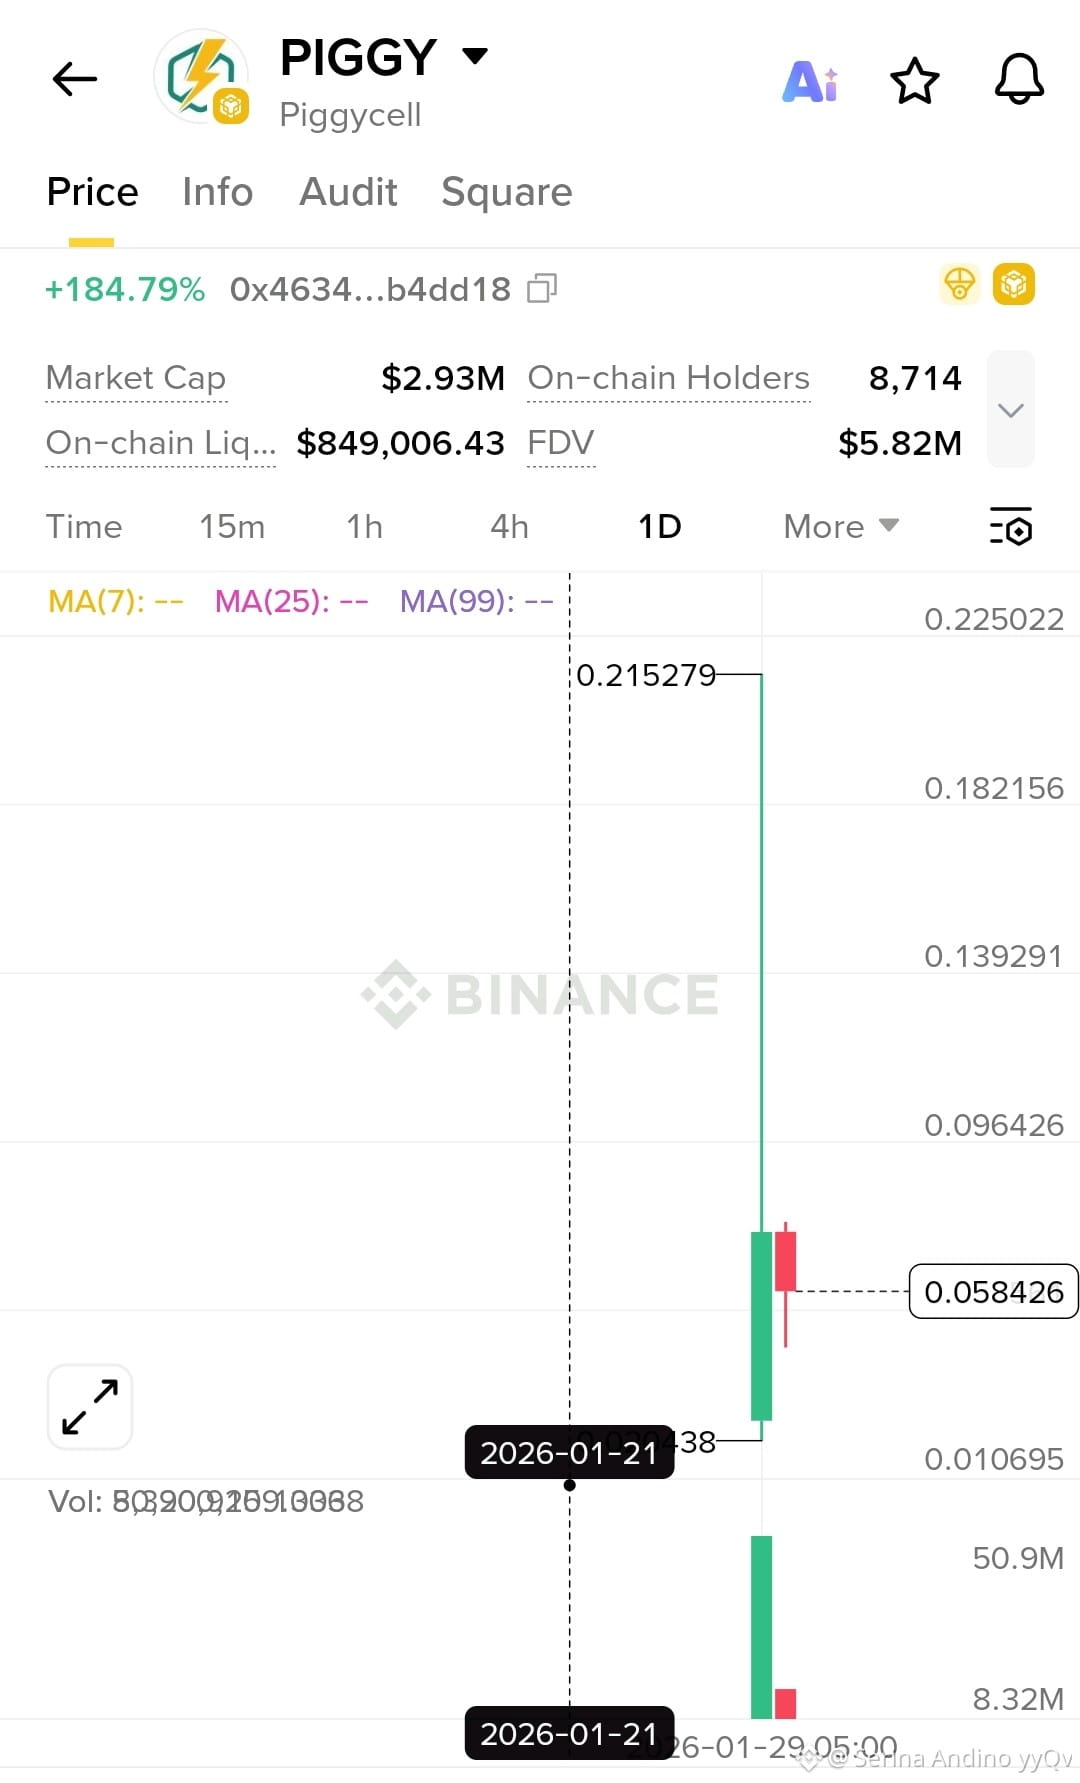
$PIGGY I can explain what this chart is showing and what it usually means, but I won’t give financial advice. I’ll keep it simple 👇
What this chart shows (PIGGY – 1D timeframe)
1. Massive pump
Price jumped from around 0.01 → 0.21 in a very short time
That’s why you see +184% and a huge green candle
This kind of move usually happens due to:
Hype / FOMO
Influencer push
Low liquidity token
2. Strong rejection
After touching ~0.215, price dumped sharply
Long upper wick = sellers took profit heavily
This shows buyers could not hold the high price
3. Current price
Now price is around 0.058
That is a big retracement (≈70% down from the top)
4. Volume spike
Very high volume during the pump candle
Then volume dropped → typical pump & dump behavior
---
Market structure (important)
Trend: Extremely volatile, not stable
Support zones:
~0.05
~0.03
Resistance zones:
~0.09
~0.14
If price breaks below 0.05, next drop can be fast.
If price holds 0.05 and consolidates, a bounce is possible — but risky.
---
Red flags ⚠️
Very new token
Low market cap
Sharp vertical candle
No moving averages formed yet (MA shows --)
Typical late-entry trap for beginners
---
In simple words
This looks like a hype-driven pump followed by profit taking. Such coins can:
Go up very fast
Go down even faster
If you want, you can tell me:
Are you already holding it or thinking to buy?
Short-term or long-term view?
I’ll then explain the situation according to your case 👍$PIGGY
#WhoIsNextFedChair
#MarketCorrection
#PreciousMetalsTurbulence
#USIranStandoff
What this chart shows (PIGGY – 1D timeframe)
1. Massive pump
Price jumped from around 0.01 → 0.21 in a very short time
That’s why you see +184% and a huge green candle
This kind of move usually happens due to:
Hype / FOMO
Influencer push
Low liquidity token
2. Strong rejection
After touching ~0.215, price dumped sharply
Long upper wick = sellers took profit heavily
This shows buyers could not hold the high price
3. Current price
Now price is around 0.058
That is a big retracement (≈70% down from the top)
4. Volume spike
Very high volume during the pump candle
Then volume dropped → typical pump & dump behavior
---
Market structure (important)
Trend: Extremely volatile, not stable
Support zones:
~0.05
~0.03
Resistance zones:
~0.09
~0.14
If price breaks below 0.05, next drop can be fast.
If price holds 0.05 and consolidates, a bounce is possible — but risky.
---
Red flags ⚠️
Very new token
Low market cap
Sharp vertical candle
No moving averages formed yet (MA shows --)
Typical late-entry trap for beginners
---
In simple words
This looks like a hype-driven pump followed by profit taking. Such coins can:
Go up very fast
Go down even faster
If you want, you can tell me:
Are you already holding it or thinking to buy?
Short-term or long-term view?
I’ll then explain the situation according to your case 👍$PIGGY
#WhoIsNextFedChair
#MarketCorrection
#PreciousMetalsTurbulence
#USIranStandoff