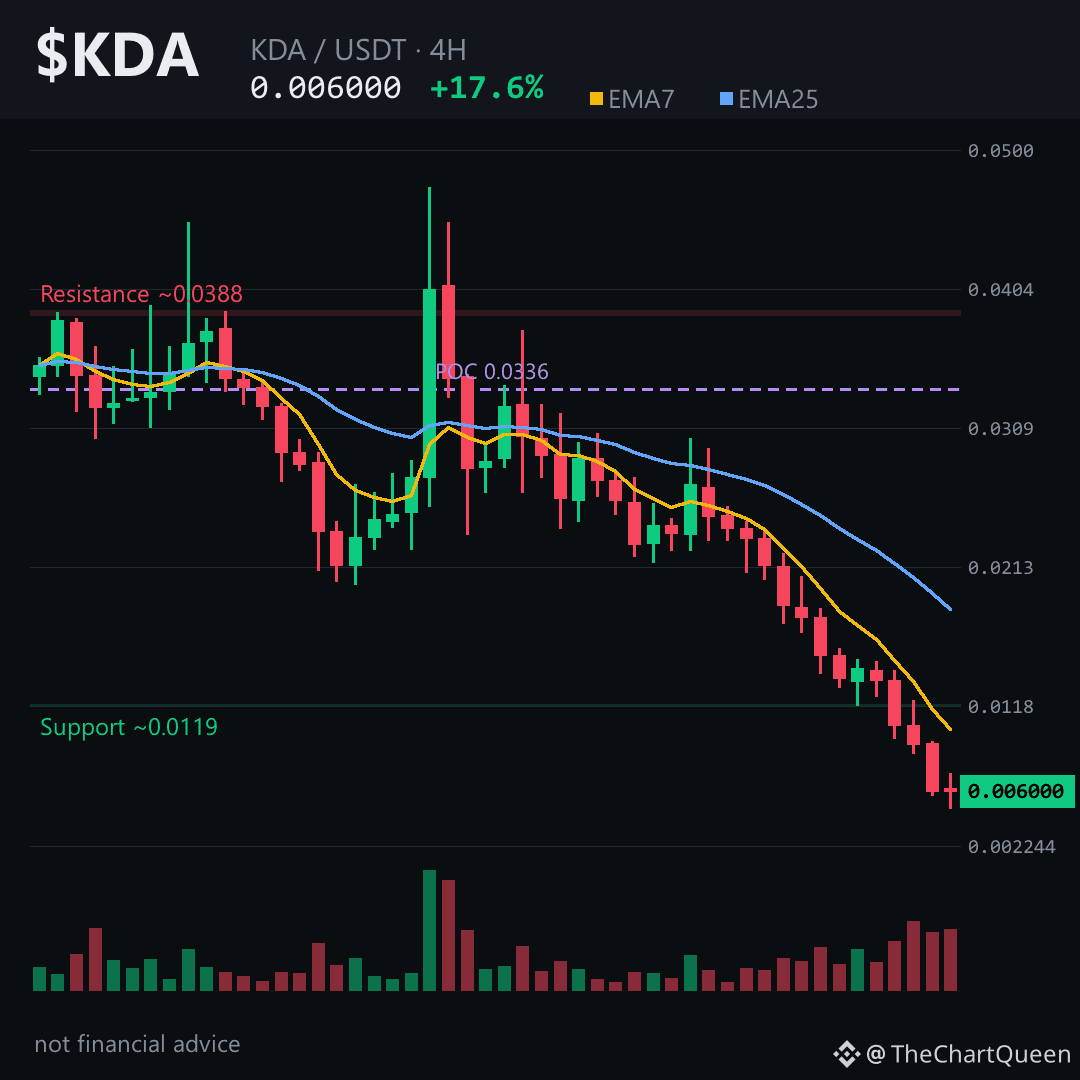
لماذا ارتفع $KDA بنسبة 17% في نفس اليوم، بينما المخطط يغرق باللون الأحمر في كل إطار زمني مهم؟
هذا ليس صعودًا — بل ارتداد «قط ميت» داخل شلال. شموع 4H تروي القصة الحقيقية: أحد عشر شمعة حمراء من آخر اثنتي عشرة، بما في ذلك شمعة واحدة بنسبة -35%. انهار السعر من حوالي 0.024 إلى 0.006 خلال يومين تقريبًا. ووسم «Top Gainer» مجرد نافذة الـ 24 ساعة التي تلتقط ارتدادًا بسيطًا عند القيعان.
الارتداد يحدث مباشرة تحت فجوة هبوط غير مملوءة على 4H — تقريبًا بين 0.0094 و0.0096. الفجوات من هذا النوع غالبًا ما تعمل كمغناطيس، لكن السعر يميل لإعادة اختبار الجانب السفلي أولًا.
بنية 4H هي أوضح قراءة. السعر يتذبذب قرب 0.0060، وأي قوة تفشل في استعادة حوالي 0.0063 تبقي الميل هبوطيًا بقوة. إلى الأسفل، يقع الهدف التالي قرب 0.0055. إذا فقدت تلك المنطقة عند إغلاق على 4H، سيفتح المخطط باتجاه الهدف الأكبر قرب 0.0038 — رفّ تاريخي لحجم التداول. افتح $KDA لتظهر لك المخطط وشاهد كيف هبط السعر درجًا عبر كل مستويات الدعم السابقة بشكل نظيف.
قراءتي: هذه «سكين ساقط» مع قبضة ضعيفة. الصعود محدود بتلك الفجوة غير المملوءة فوق السعر، والمسار الأسهل لا يزال يشير إلى الأسفل حتى يثبت المشترون أنهم قادرون على الثبات فوق 0.0063.
تابعني — سأحدّث هذه القراءة إذا بدأ السعر بإغلاقه مجددًا فوق منطقة الفجوة تلك، لأن هذا سيكون أول علامة حقيقية على تكوّن قاع.
هل تراقب دعم 0.0055 أم فجوة 0.0094 عن كثب على $KDA؟ 👇
⚠️ ليست نصيحة مالية. DYOR.
#KDA #Kadena #Crypto #BinanceSquare
هذا ليس صعودًا — بل ارتداد «قط ميت» داخل شلال. شموع 4H تروي القصة الحقيقية: أحد عشر شمعة حمراء من آخر اثنتي عشرة، بما في ذلك شمعة واحدة بنسبة -35%. انهار السعر من حوالي 0.024 إلى 0.006 خلال يومين تقريبًا. ووسم «Top Gainer» مجرد نافذة الـ 24 ساعة التي تلتقط ارتدادًا بسيطًا عند القيعان.
الارتداد يحدث مباشرة تحت فجوة هبوط غير مملوءة على 4H — تقريبًا بين 0.0094 و0.0096. الفجوات من هذا النوع غالبًا ما تعمل كمغناطيس، لكن السعر يميل لإعادة اختبار الجانب السفلي أولًا.
بنية 4H هي أوضح قراءة. السعر يتذبذب قرب 0.0060، وأي قوة تفشل في استعادة حوالي 0.0063 تبقي الميل هبوطيًا بقوة. إلى الأسفل، يقع الهدف التالي قرب 0.0055. إذا فقدت تلك المنطقة عند إغلاق على 4H، سيفتح المخطط باتجاه الهدف الأكبر قرب 0.0038 — رفّ تاريخي لحجم التداول. افتح $KDA لتظهر لك المخطط وشاهد كيف هبط السعر درجًا عبر كل مستويات الدعم السابقة بشكل نظيف.
قراءتي: هذه «سكين ساقط» مع قبضة ضعيفة. الصعود محدود بتلك الفجوة غير المملوءة فوق السعر، والمسار الأسهل لا يزال يشير إلى الأسفل حتى يثبت المشترون أنهم قادرون على الثبات فوق 0.0063.
تابعني — سأحدّث هذه القراءة إذا بدأ السعر بإغلاقه مجددًا فوق منطقة الفجوة تلك، لأن هذا سيكون أول علامة حقيقية على تكوّن قاع.
هل تراقب دعم 0.0055 أم فجوة 0.0094 عن كثب على $KDA؟ 👇
⚠️ ليست نصيحة مالية. DYOR.
#KDA #Kadena #Crypto #BinanceSquare