$MVLLB
Looking closely at the MVLLB/USDT 4-hour chart setup:
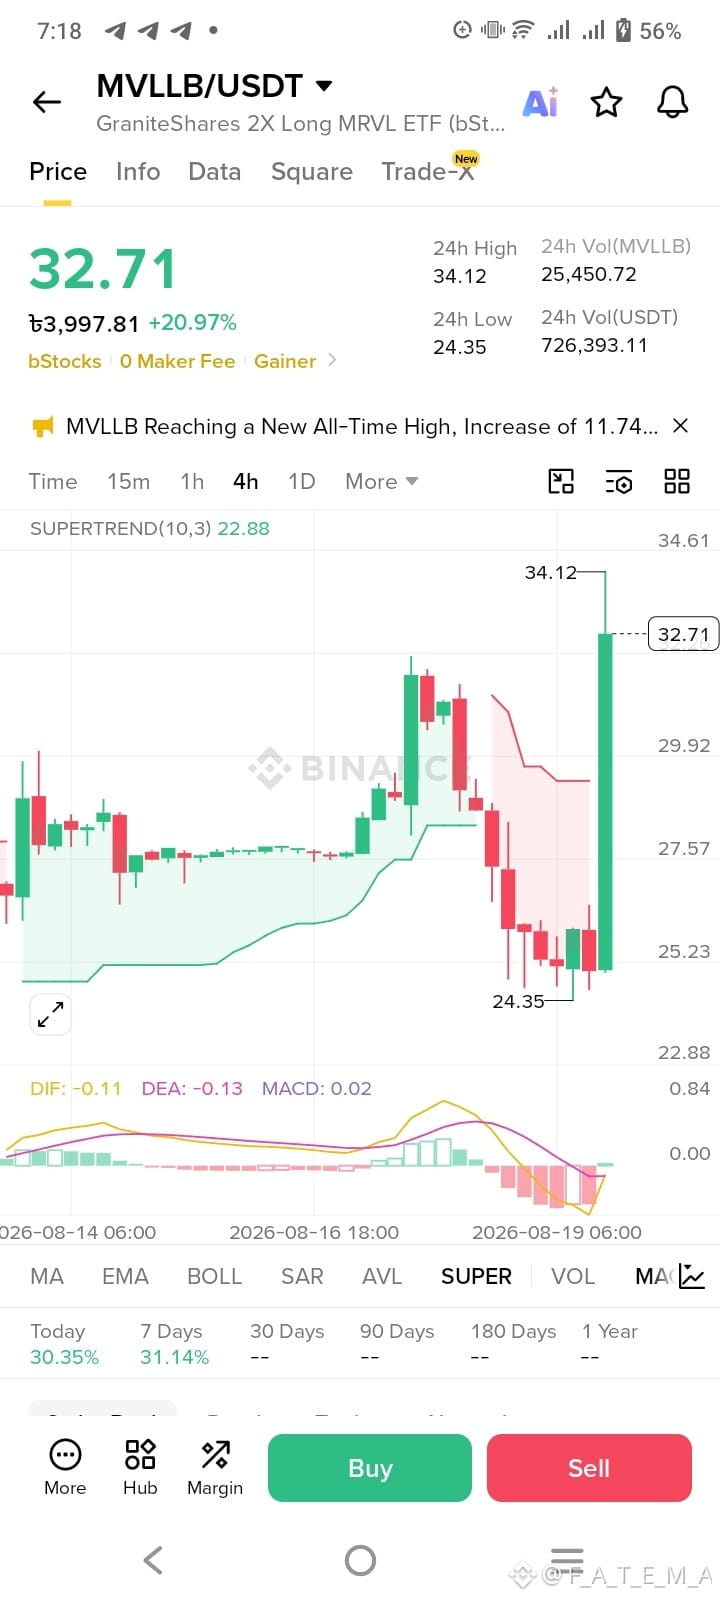
Price Action & Trend: MVLLB has broken out aggressively to the upside, registering a +20.97% gain and pressing near its 24-hour high of 34.12 (trading at 32.71 USDT).
The massive green impulse candle indicates high buyer aggression following a consolidation/re-accumulation phase near the 24.35 support floor.
SuperTrend Indicator: The SuperTrend indicator has flipped heavily bullish (green zone), providing dynamic support underneath current price action.
MACD Indicator: The Moving Average Convergence Divergence (MACD) shows the histogram turning positive (\text{MACD} = 0.02) with the DIF line crossing near or above the DEA signal lines, confirming an influx of short-term bullish momentum after a prior consolidation period.
Volume & Volatility: High volatility is present as the token approaches new local highs, meaning traders should watch for potential short-term pullbacks or retests of breakout zones before continuation.
Key Trade Setup & Risk Management Strategy
Bias: Bullish on momentum continuation, but cautious of a retest due to the steep vertical spike.
Support Levels: Look for potential retest zones around the 27.50 – 29.90 region if minor profit-taking occurs.
Risk Control: For high-momentum tokens like these, always utilize trailing stop-losses or lock in partial profits at key resistance targets to protect capital against sudden market reversals.
Disclaimer: This analysis is for informational and educational purposes only and does not constitute financial advice. Always perform your own due diligence and manage your risk strictly.
#FutureTarding
Looking closely at the MVLLB/USDT 4-hour chart setup:
Price Action & Trend: MVLLB has broken out aggressively to the upside, registering a +20.97% gain and pressing near its 24-hour high of 34.12 (trading at 32.71 USDT).
The massive green impulse candle indicates high buyer aggression following a consolidation/re-accumulation phase near the 24.35 support floor.
SuperTrend Indicator: The SuperTrend indicator has flipped heavily bullish (green zone), providing dynamic support underneath current price action.
MACD Indicator: The Moving Average Convergence Divergence (MACD) shows the histogram turning positive (\text{MACD} = 0.02) with the DIF line crossing near or above the DEA signal lines, confirming an influx of short-term bullish momentum after a prior consolidation period.
Volume & Volatility: High volatility is present as the token approaches new local highs, meaning traders should watch for potential short-term pullbacks or retests of breakout zones before continuation.
Key Trade Setup & Risk Management Strategy
Bias: Bullish on momentum continuation, but cautious of a retest due to the steep vertical spike.
Support Levels: Look for potential retest zones around the 27.50 – 29.90 region if minor profit-taking occurs.
Risk Control: For high-momentum tokens like these, always utilize trailing stop-losses or lock in partial profits at key resistance targets to protect capital against sudden market reversals.
Disclaimer: This analysis is for informational and educational purposes only and does not constitute financial advice. Always perform your own due diligence and manage your risk strictly.
#FutureTarding