$BTC ربما ستحتاج إلى حفظ هذا
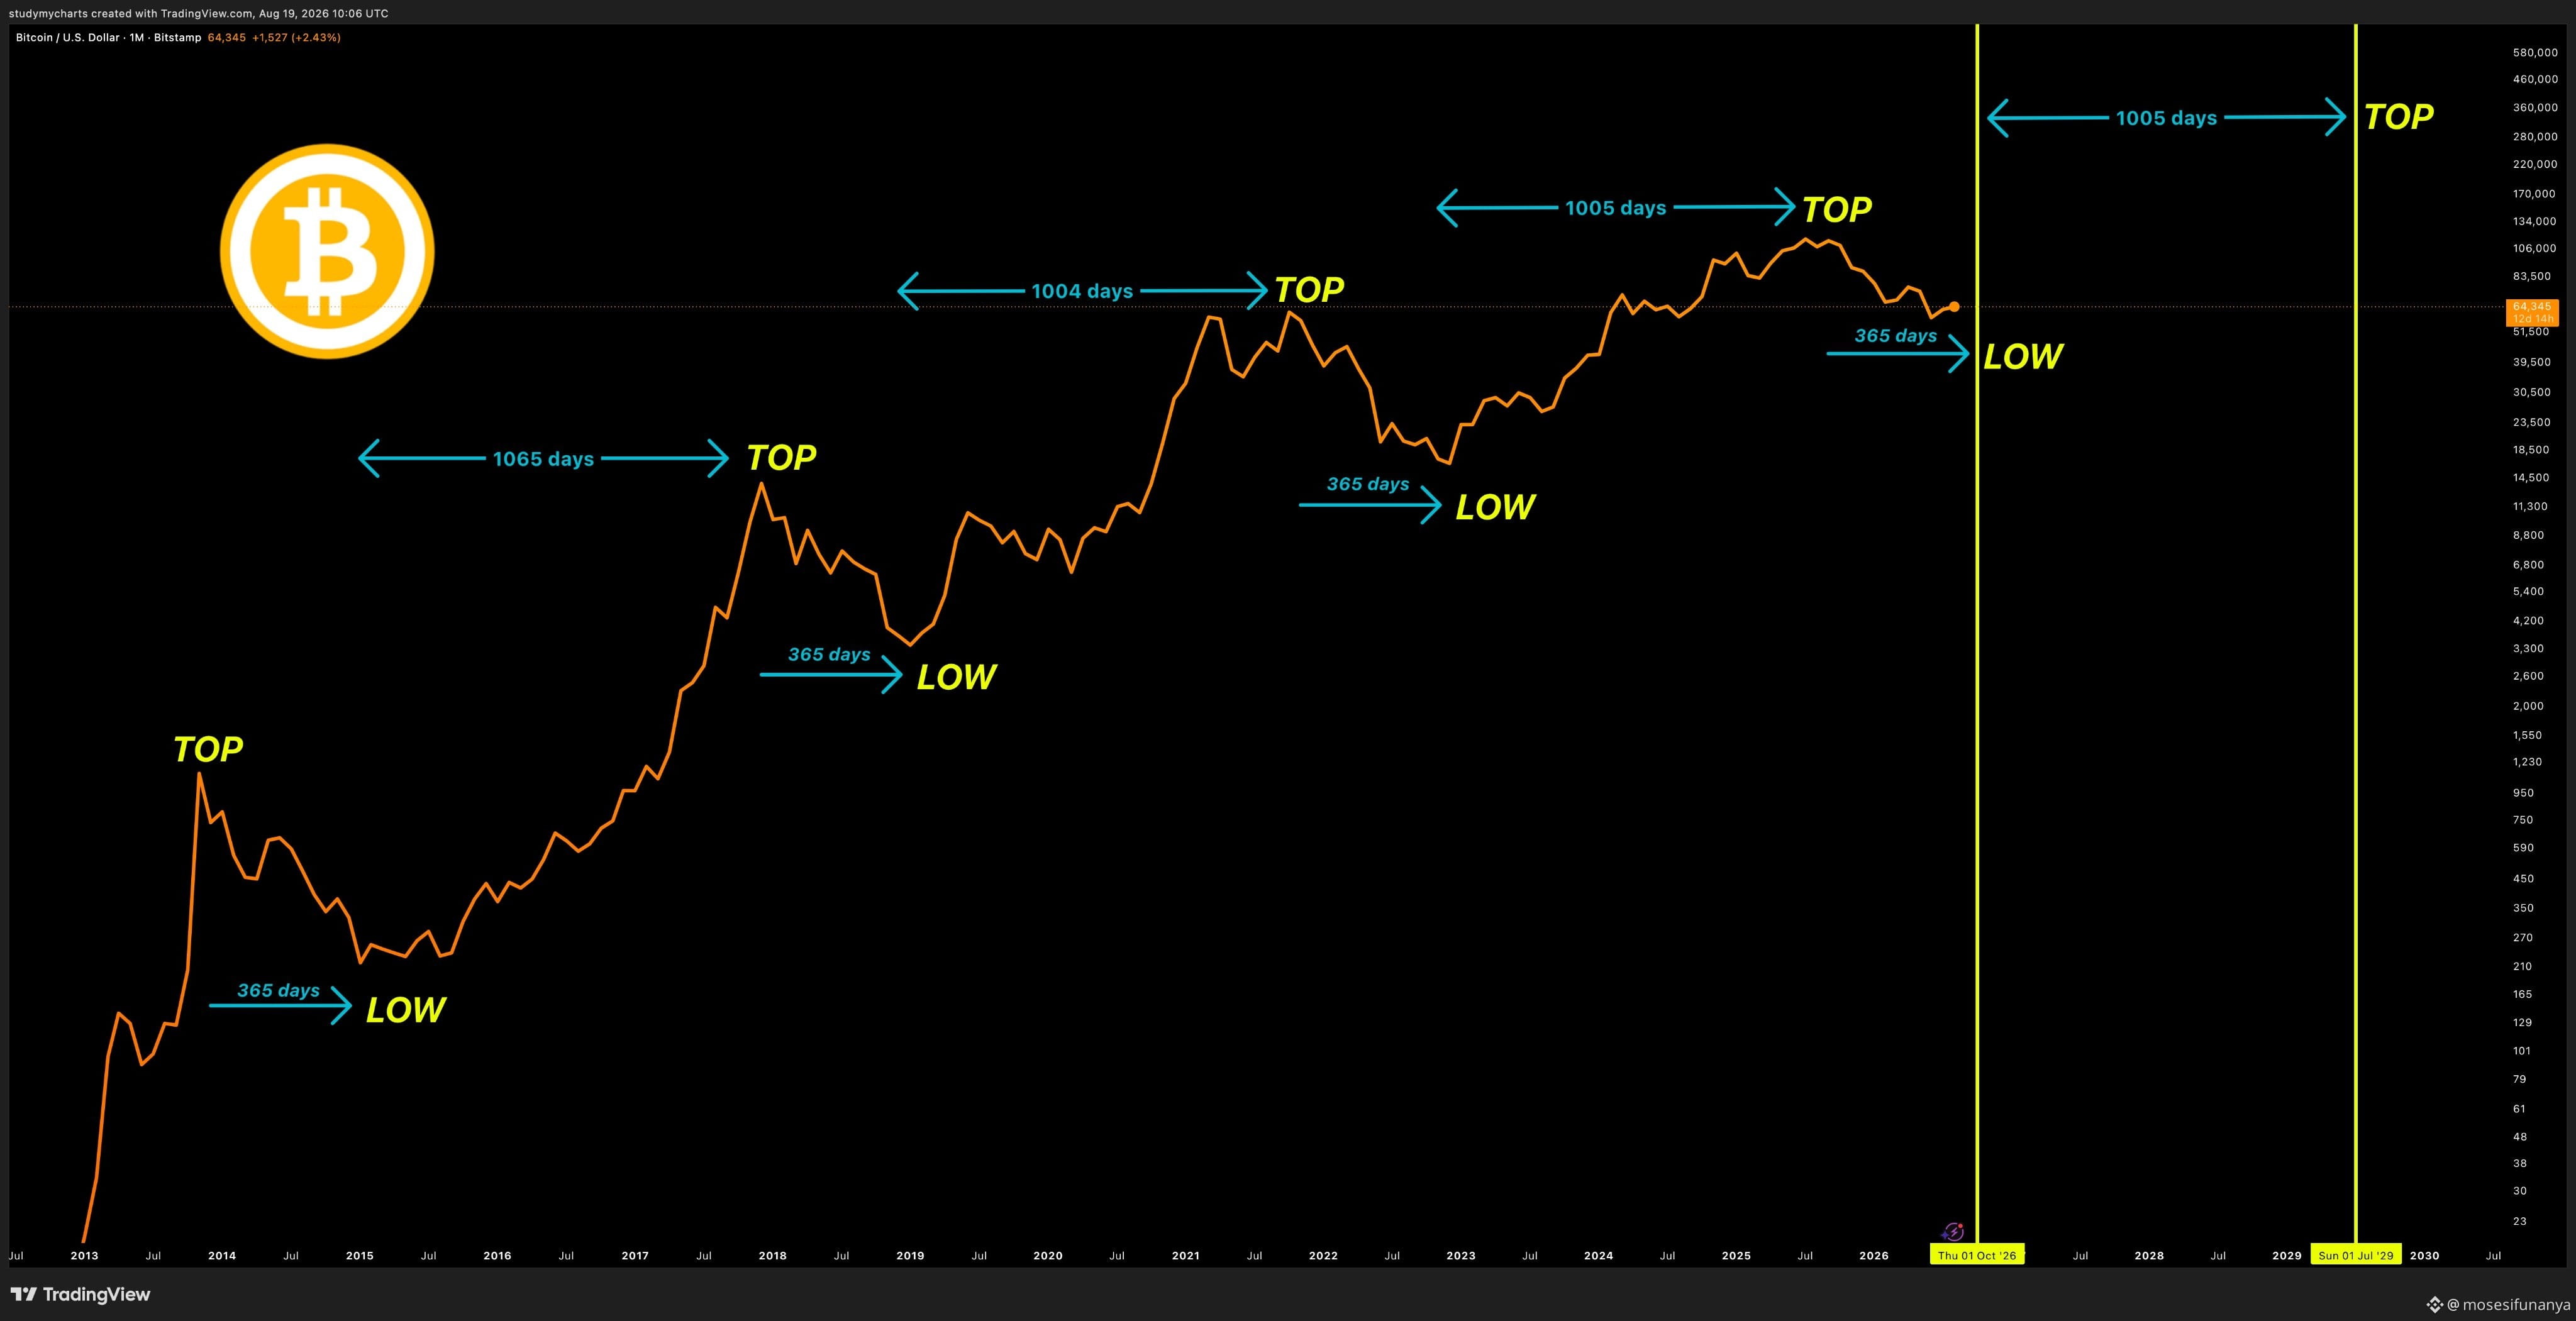
هذا الرسم البياني هو في الأساس كل ما تحتاجه لتوقيت الدورة، متى تشتري القاع ومتى تبيع القمة
every ATH → القاع يحدث بعد ~365 يومًا، أربع دورات متتالية
every bottom → حوالي 1000 يوم من مسار صاعد للوصول إلى قمة ATH جديدة
الخبر العظيم هو أننا إما عند القاع أو أننا تجاوزناه بالفعل، فالفترة الزمنية الآن
وهذا يعني أن ما يلي هو مرحلة الـ 1000 يوم
أربع دورات لنفس القياس؛ هذه ليست رأيًا، بل هي النمط
$BTC
هذا الرسم البياني هو في الأساس كل ما تحتاجه لتوقيت الدورة، متى تشتري القاع ومتى تبيع القمة
every ATH → القاع يحدث بعد ~365 يومًا، أربع دورات متتالية
every bottom → حوالي 1000 يوم من مسار صاعد للوصول إلى قمة ATH جديدة
الخبر العظيم هو أننا إما عند القاع أو أننا تجاوزناه بالفعل، فالفترة الزمنية الآن
وهذا يعني أن ما يلي هو مرحلة الـ 1000 يوم
أربع دورات لنفس القياس؛ هذه ليست رأيًا، بل هي النمط
$BTC