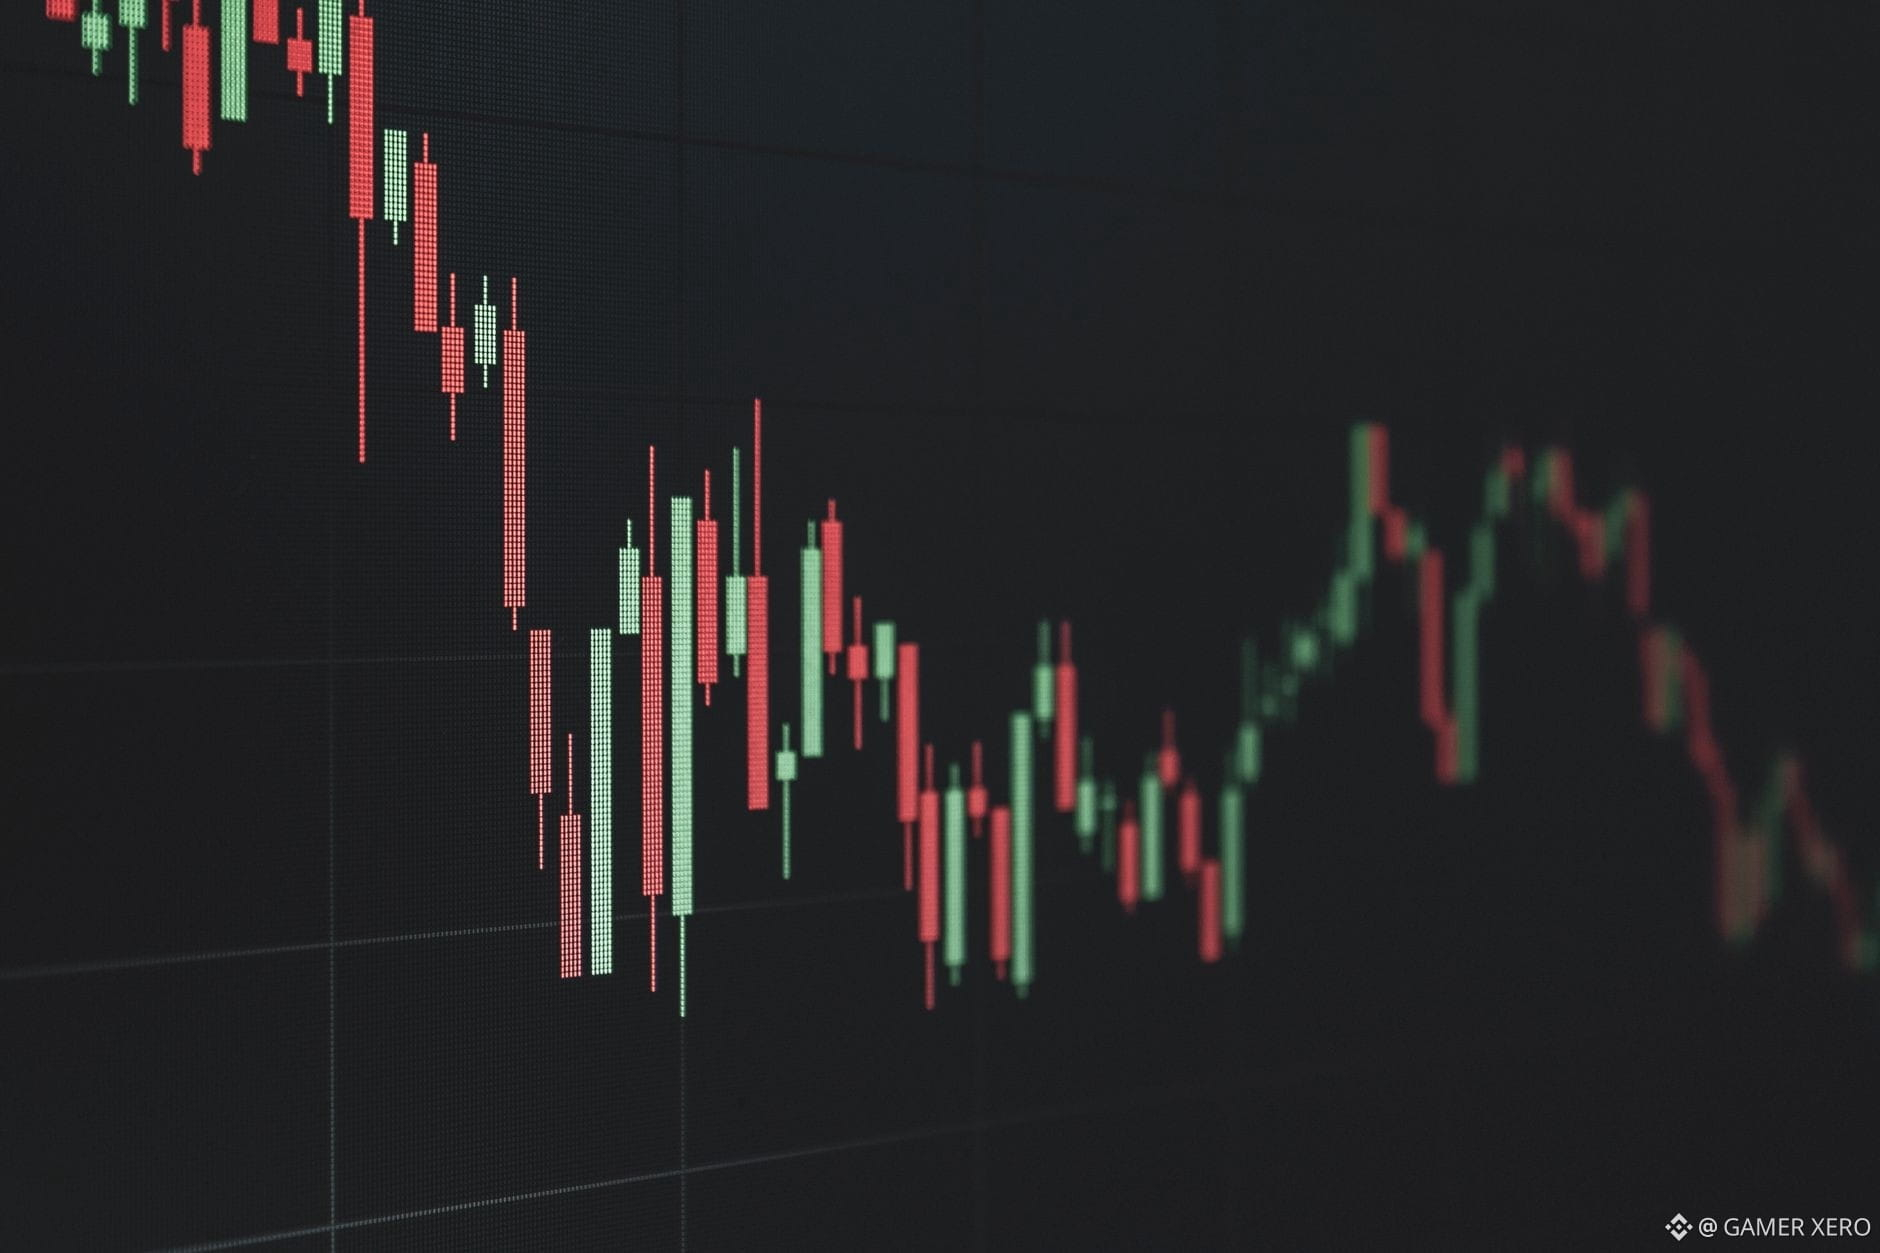
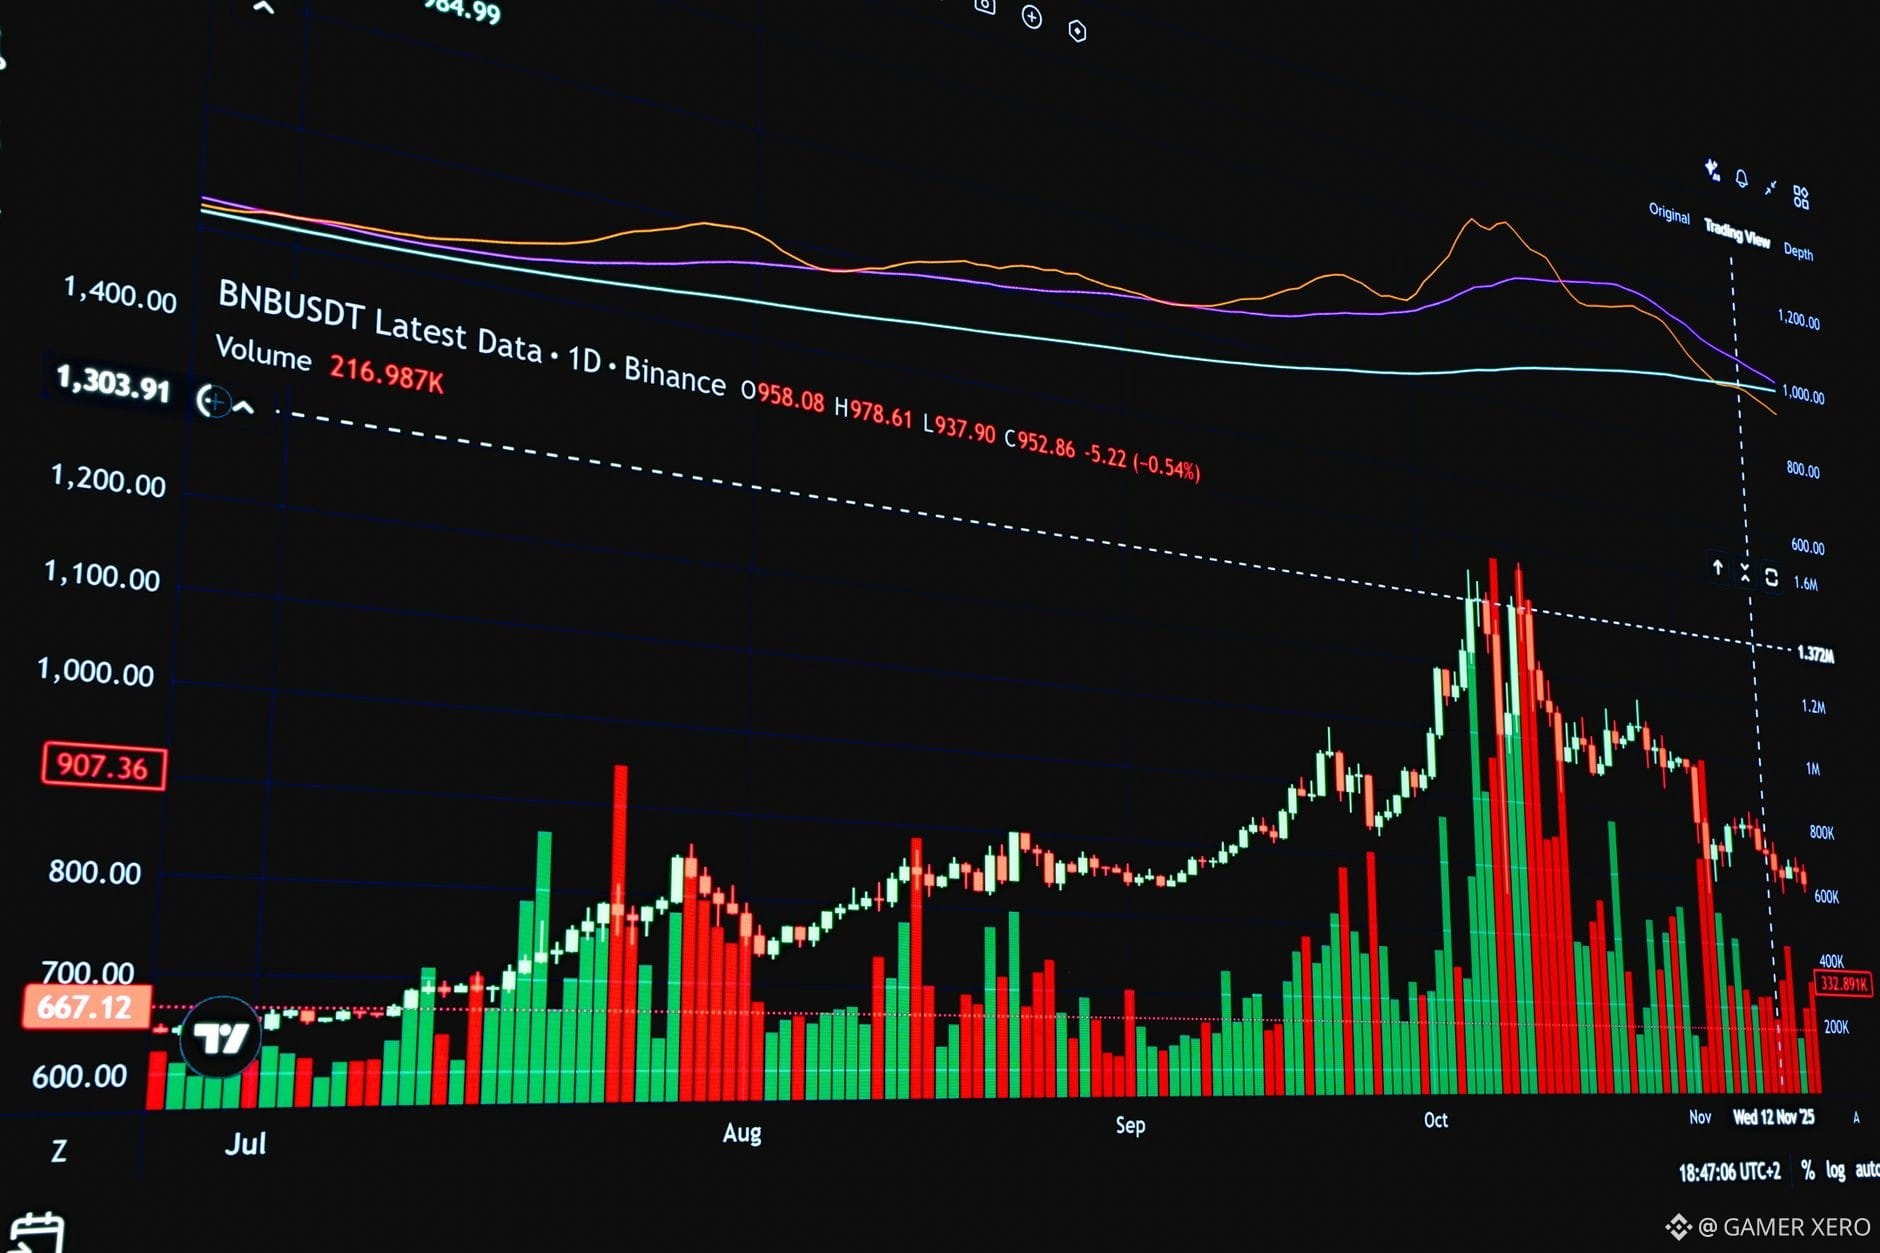
إن مشاهدة $BTC محشورًا بإحكام بين $64,027 و$65,058 على Binance يجعل دفتر الأوامر يبدو دليلًا واضحًا بشكل مدهش. افتح عرض العمق وستلاحظ وجود جدار من أوامر الشراء يتجمع حول $64,530-$64,540، بينما تتخفف أوامر البيع مباشرةً فوق $64,560. تعكس هذه اللخبطة قصة بسيطة: المشترون يدافعون عن النطاق الحالي، وأي اختراق فوق $64,560 سيتطلب ابتلاع جانب البيع الرقيق للحفاظ على الصعود.
عمليًا، يمكنك وضع أمر محدد (Limit) داخل جدار الشراء قليلًا—مثلًا عند $64,535. إذا تحرك السعر قليلًا للأعلى ووصل إلى أمرِك، فمن المرجح أن تُملأ بسعر يكون الطلب عنده قويًا بالفعل، ما يقلل الانزلاق. بالمقابل، يمكن وضع وقف خسارة (Stop‑loss) أسفل الجدار السفلي مباشرةً، حوالي $64,030، بما يحترم خريطة السيولة نفسها ويساعدك على الخروج إذا بدأ البائعون يسيطرون.
الرسالة الأساسية هي أن دفتر الأوامر ليس مجرد أرقام؛ بل إنه يصوّر الدعم والمقاومة في الوقت الحقيقي. كيف تُدرج بيانات العمق في خطط دخولك أو خروجك أنت؟
#CryptoTools #OrderBook #TradingTips #GAMERXERO
عمليًا، يمكنك وضع أمر محدد (Limit) داخل جدار الشراء قليلًا—مثلًا عند $64,535. إذا تحرك السعر قليلًا للأعلى ووصل إلى أمرِك، فمن المرجح أن تُملأ بسعر يكون الطلب عنده قويًا بالفعل، ما يقلل الانزلاق. بالمقابل، يمكن وضع وقف خسارة (Stop‑loss) أسفل الجدار السفلي مباشرةً، حوالي $64,030، بما يحترم خريطة السيولة نفسها ويساعدك على الخروج إذا بدأ البائعون يسيطرون.
الرسالة الأساسية هي أن دفتر الأوامر ليس مجرد أرقام؛ بل إنه يصوّر الدعم والمقاومة في الوقت الحقيقي. كيف تُدرج بيانات العمق في خطط دخولك أو خروجك أنت؟
#CryptoTools #OrderBook #TradingTips #GAMERXERO