$HEMI
Market Overview & Price Action
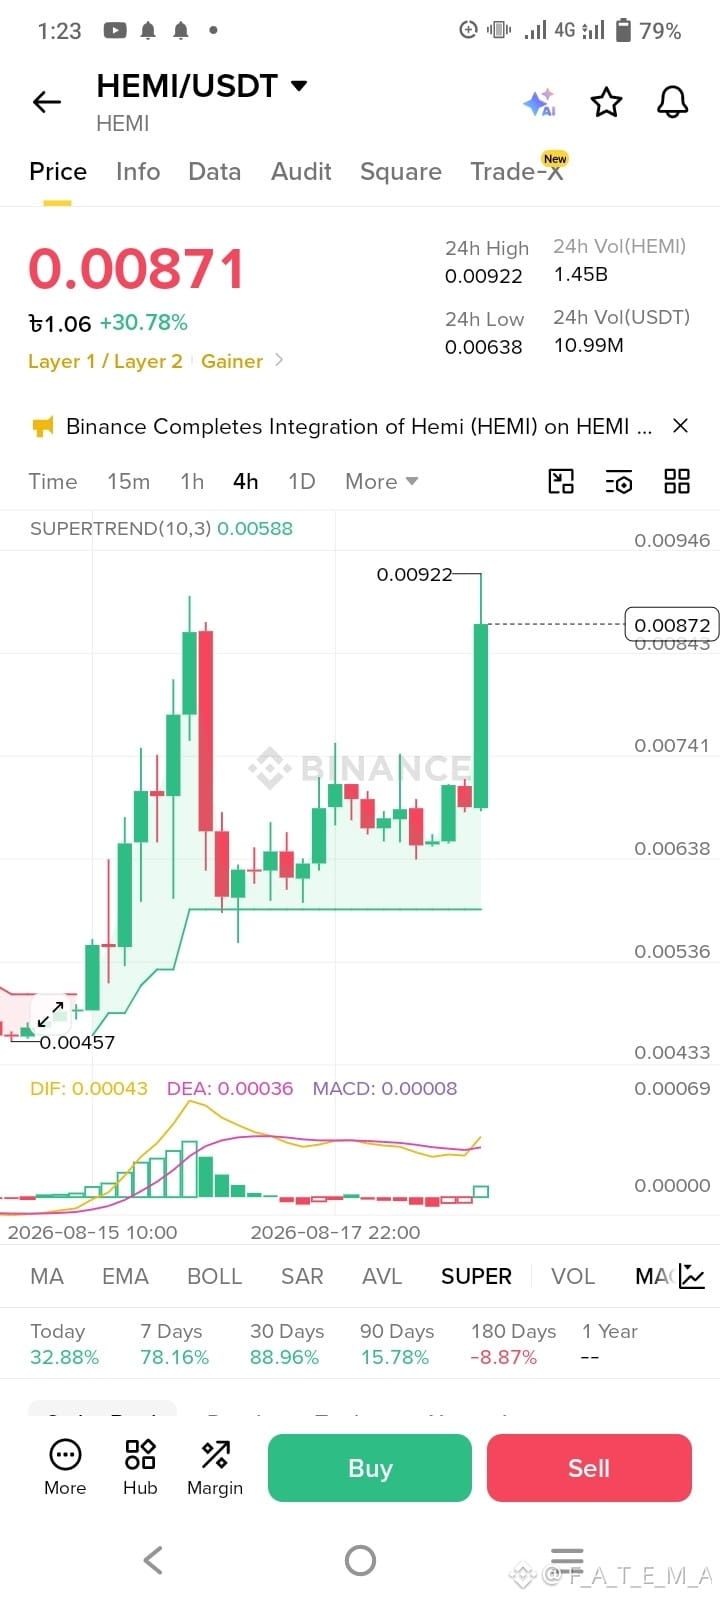
Current Price: 0.00871 USDT (showing a strong intraday gain of +30.78%).
24-Hour Range: Ranged from a low of 0.00638 up to a high of 0.00922.
Volume: Strong trading activity with a 24h volume of 1.45B HEMI (approx. 10.99M USDT).
Timeframe: 4-hour (4h) chart, showing recent explosive bullish momentum starting from a low of 0.00457 on August 15.
Indicator Breakdown
1. SuperTrend (10, 3)
Status: Strongly Bullish.
Details: The SuperTrend line rests significantly lower at 0.00588 (colored green), indicating that the broader medium-term trend on this 4-hour frame remains firmly under buyer control.
2. MACD (Moving Average Convergence Divergence)
Status: Bullish momentum picking back up.
Details:
DIF (0.00043) is positioned above DEA (0.00036).
The MACD histogram has printed positive green bars again, signaling renewed buying pressure after a brief consolidation phase.
3. Performance Metrics
Today: +32.88%
7 Days: +78.16%
30 Days: +88.96%
Summary & Key Levels
Resistance: 0.00922 (the 24-hour high and recent peak). Breaking above this level could target psychological thresholds higher up.
Support: 0.00741 to 0.00638 range, with the major structural trend support down at the SuperTrend level of 0.00588.
Would you like to explore potential entry or exit strategies based on these indicators?
#FutureTarding #HEMI
Market Overview & Price Action
Current Price: 0.00871 USDT (showing a strong intraday gain of +30.78%).
24-Hour Range: Ranged from a low of 0.00638 up to a high of 0.00922.
Volume: Strong trading activity with a 24h volume of 1.45B HEMI (approx. 10.99M USDT).
Timeframe: 4-hour (4h) chart, showing recent explosive bullish momentum starting from a low of 0.00457 on August 15.
Indicator Breakdown
1. SuperTrend (10, 3)
Status: Strongly Bullish.
Details: The SuperTrend line rests significantly lower at 0.00588 (colored green), indicating that the broader medium-term trend on this 4-hour frame remains firmly under buyer control.
2. MACD (Moving Average Convergence Divergence)
Status: Bullish momentum picking back up.
Details:
DIF (0.00043) is positioned above DEA (0.00036).
The MACD histogram has printed positive green bars again, signaling renewed buying pressure after a brief consolidation phase.
3. Performance Metrics
Today: +32.88%
7 Days: +78.16%
30 Days: +88.96%
Summary & Key Levels
Resistance: 0.00922 (the 24-hour high and recent peak). Breaking above this level could target psychological thresholds higher up.
Support: 0.00741 to 0.00638 range, with the major structural trend support down at the SuperTrend level of 0.00588.
Would you like to explore potential entry or exit strategies based on these indicators?
#FutureTarding #HEMI