
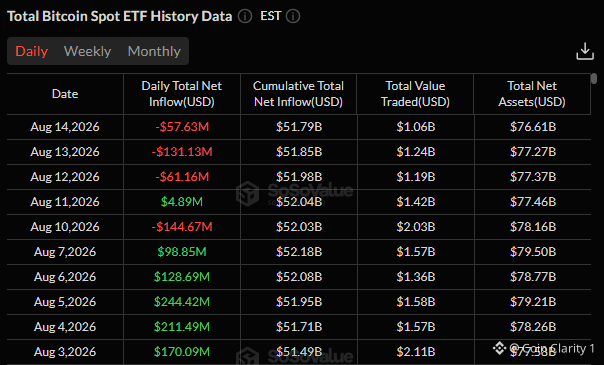
أنهى البيتكوين شهر أغسطس باللون الأحمر في 9 من آخر 13 أغسطس. وأنهت الأربعة أغسطسات الأحدث، من 2022 حتى 2025، باللون الأحمر على التوالي. وهذا السجل هو الجزء الذي يجذب الانتباه. لكنه أيضًا أقل جزء فائدة من البيانات. إليك الآلية التي تستحق الفهم فعلًا. متوسط عائد أغسطس منذ 2013 سلبي بنسبة 3.08%. والوسيط يبلغ سالب 7.49%. يظهر هذا الفارق بين المتوسط والوسيط لأن عامين استثنائيين، 2013 و2017، سجلا مكاسب هائلة لشهر واحد رفعت المتوسط للأعلى، بينما ما يزال شهر أغسطس «المعتاد» والأكثر تمثيلًا يُغلق بخسارة حادة. وعندما يتباعد المتوسط والوسيط بهذا الشكل، تخبرنا قيمة الوسيط بقصة أكثر صدقًا عمّا يحدث عادةً. إليك ما يكسر النمط تاريخيًا، إذ إن ثلاثة أغسطسات فقط أغلقت باللون الأخضر. فـ2013 و2020 و2021 جميعها تشترك في سمة لم تكن لدى أغسطسات الأشهر التسعة الحمراء: زخمٌ قائمٌ قوي قبل بداية الشهر، بدلًا من التماسك بعد يوليو ضعيف. أغلقت يوليو 2026 على ارتفاع قدره 9.8%، وبشكلٍ مشابه لطبيعة الزخم الذي سبق اثنين من أصل أغسطسات خضراء الثلاثة. $BTC حاليًا تحت كلٍّ من متوسطه المتحرك الأُسي لـ50 يومًا و200 يوم، وهو أمر لم يتزامن أبدًا مع أغسطس أخضر في مجموعة بيانات هذه التي تمتد 13 عامًا. $BTC هل توفر ارتدة يوليو زخمًا كافيًا لكسر النمط، أم أن التداول تحت المتوسطين المتحركين الرئيسيين يحسم السؤال قبل أن يبدأ أغسطس حتى؟ #BTC Price Analysis# #Bitcoin Price Prediction: What is Bitcoins next move?# #Macro Insights# #Altcoin Season#


نشر
إخلاء مسؤولية: يتضمن آراء جهات خارجية. لا تُعدّ نصيحة. يُمكن استخدام Binance AI دون أي ضمان. اطلع على الشروط والأحكام.