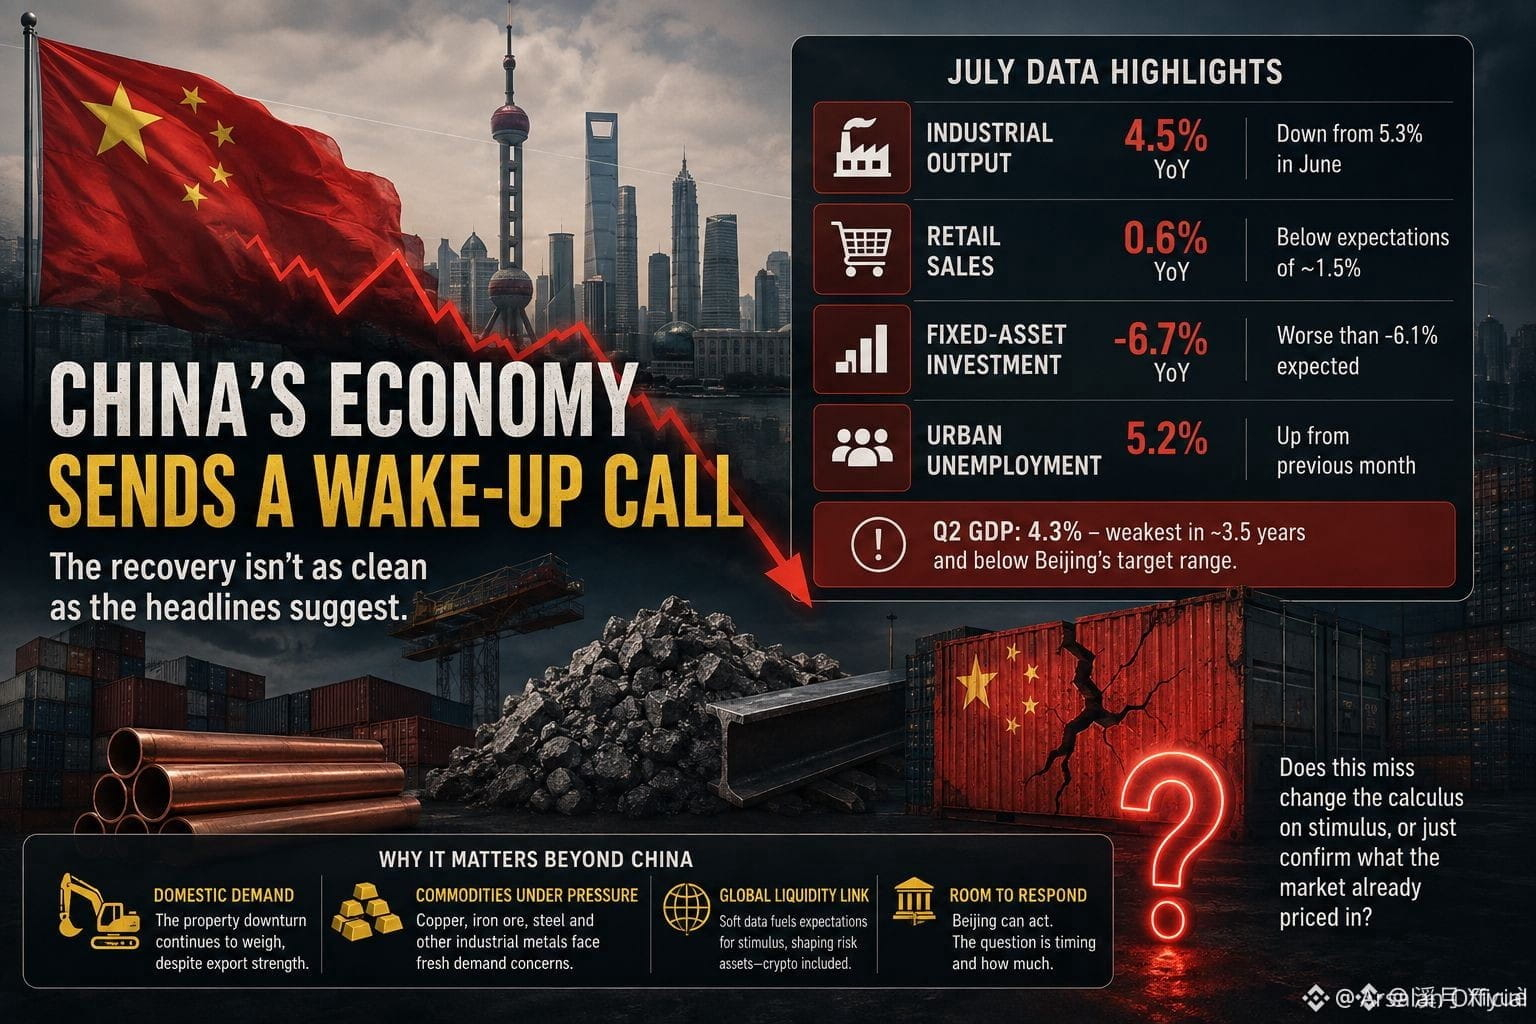
#ChinaJulyOutputRetailInvestmentAllMiss الهاشتاغ الرائج **#ChinaJulyOutputRetailInvestmentAllMiss** يتّبع بيانات اقتصادية رسمية صادرة عن مكتب الإحصاءات الوطنية الصيني (NBS) تُظهر تباطؤًا واسع النطاق عبر مؤشرات النشاط الرئيسية في يوليو 2026.
ووفقًا للمؤشرات الكلية الرئيسية — الإنتاج الصناعي، والمبيعات بالتجزئة، والاستثمار في الأصول الثابتة — فقد فاتت جميعها توقعات السوق المتفق عليها في الوقت نفسه، ما يشير إلى تجدد الضغط على الزخم المحلي.
---
### تفصيل البيانات الاقتصادية (يوليو 2026)
| المؤشر | الفعلي | التوقع / السابق | التفاصيل |
| --- | --- | --- | --- |
| **الإنتاج الصناعي** | **+4.5% على أساس سنوي** | ~5.0% متوقع *(5.3% في يونيو)* | تباطؤ نمو التصنيع وتعطلات جوية شديدة أثّرت على مخرجات المصانع. |
| **المبيعات بالتجزئة** | **+0.6% على أساس سنوي** | ~1.5% متوقع *(1.0% في يونيو)* | إنفاق المستهلكين كان ضعيفًا؛ وانخفضت مبيعات المركبات السياحية بشكل ملحوظ (~17–21%). |
| **الاستثمار في الأصول الثابتة** | **-6.7% على أساس سنوي** *(يناير–يوليو)* | ~-6.0% متوقع *(-5.7% في النصف الأول)* | تعمّق التراجع بسبب استمرار الضعف في بناء العقارات واستثمارات رأس المال الخاص. |
| **البطالة في المناطق الحضرية** | **5.2%** | 5.0% في يونيو | ارتفعت بشكل طفيف بسبب عوامل موسمية وضعف التوظيف في قطاع الخدمات. |
---
### أبرز العوامل المحرّكة
* **سحب قطاع العقارات & أثر الثروة:** هبط استثمار العقارات أكثر (-19.2% حتى تاريخه)، بينما واصلت أسعار المنازل الجديدة تراجعها لعدة سنوات، ما يستمر في الضغط على الميزانيات العمومية للأسر ويُضعف ثقة المستهلكين.
* **اضطرابات الطقس القاسية:** أمطار غزيرة، فيضانات، وارتفاعات شديدة في درجات الحرارة في أجزاء من البلاد عطّلت مؤقتًا عمليات الموانئ وسلاسل الإمداد وجداول المصانع.
* **تلاشي دعم التحفيز:** تباطأت في وقت سابق إعانات مبادلة السلع الاستهلاكية والنفقات الحكومية خلال الربع الثالث المبكر، ما أدى إلى دعوات لتسريع التوسع المالي.
$BNB
$BTC
$ETH
ووفقًا للمؤشرات الكلية الرئيسية — الإنتاج الصناعي، والمبيعات بالتجزئة، والاستثمار في الأصول الثابتة — فقد فاتت جميعها توقعات السوق المتفق عليها في الوقت نفسه، ما يشير إلى تجدد الضغط على الزخم المحلي.
---
### تفصيل البيانات الاقتصادية (يوليو 2026)
| المؤشر | الفعلي | التوقع / السابق | التفاصيل |
| --- | --- | --- | --- |
| **الإنتاج الصناعي** | **+4.5% على أساس سنوي** | ~5.0% متوقع *(5.3% في يونيو)* | تباطؤ نمو التصنيع وتعطلات جوية شديدة أثّرت على مخرجات المصانع. |
| **المبيعات بالتجزئة** | **+0.6% على أساس سنوي** | ~1.5% متوقع *(1.0% في يونيو)* | إنفاق المستهلكين كان ضعيفًا؛ وانخفضت مبيعات المركبات السياحية بشكل ملحوظ (~17–21%). |
| **الاستثمار في الأصول الثابتة** | **-6.7% على أساس سنوي** *(يناير–يوليو)* | ~-6.0% متوقع *(-5.7% في النصف الأول)* | تعمّق التراجع بسبب استمرار الضعف في بناء العقارات واستثمارات رأس المال الخاص. |
| **البطالة في المناطق الحضرية** | **5.2%** | 5.0% في يونيو | ارتفعت بشكل طفيف بسبب عوامل موسمية وضعف التوظيف في قطاع الخدمات. |
---
### أبرز العوامل المحرّكة
* **سحب قطاع العقارات & أثر الثروة:** هبط استثمار العقارات أكثر (-19.2% حتى تاريخه)، بينما واصلت أسعار المنازل الجديدة تراجعها لعدة سنوات، ما يستمر في الضغط على الميزانيات العمومية للأسر ويُضعف ثقة المستهلكين.
* **اضطرابات الطقس القاسية:** أمطار غزيرة، فيضانات، وارتفاعات شديدة في درجات الحرارة في أجزاء من البلاد عطّلت مؤقتًا عمليات الموانئ وسلاسل الإمداد وجداول المصانع.
* **تلاشي دعم التحفيز:** تباطأت في وقت سابق إعانات مبادلة السلع الاستهلاكية والنفقات الحكومية خلال الربع الثالث المبكر، ما أدى إلى دعوات لتسريع التوسع المالي.
$BNB
$BTC
$ETH