
15M Technical Outlook | August 16, 2026
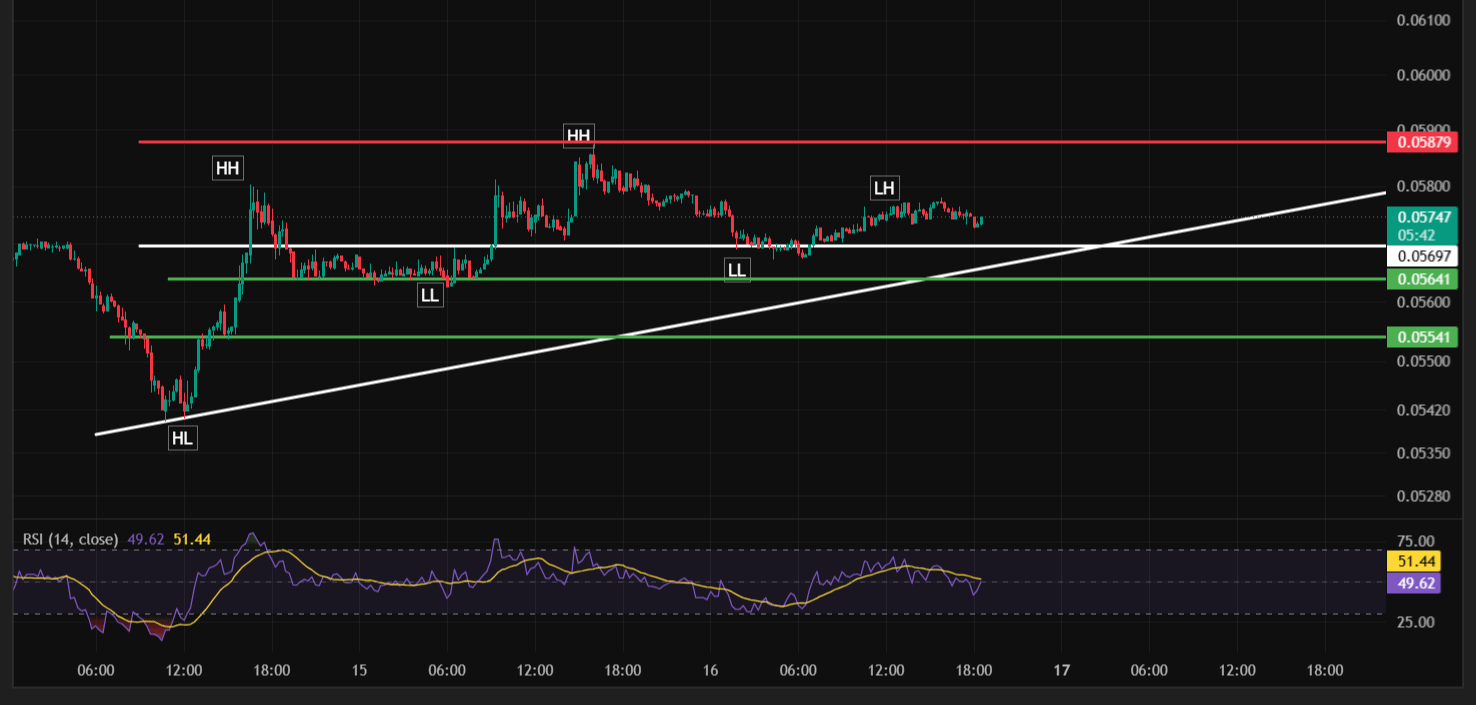
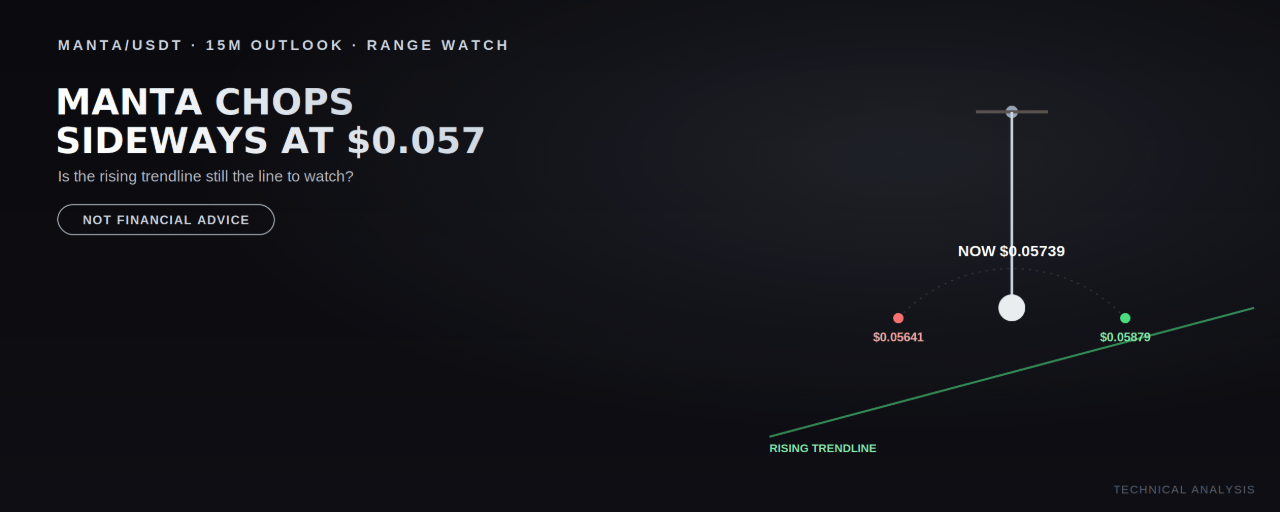
MANTA/USDT has spent the past two days going nowhere fast — bouncing between roughly $0.0564 and $0.0588 after an initial sharp rally off a Higher Low near $0.0542. Price is currently flat at $0.05739 (+0.07% today), with momentum indicators reflecting the same indecision showing up on the chart.
This article is for educational and informational purposes only. It is not financial advice. This is a choppy, range-bound market right now. False breaks in both directions are more likely than in a clean trend — wait for confirmation rather than anticipating the next move.
Market Structure: A Range Sitting on a Rising Trendline
Since the Higher Low near $0.0542, MANTA rallied sharply to a Higher High near $0.0588, then settled into a choppier phase — a Lower Low near $0.0564, another push to the same $0.0588 resistance, a pullback to a Lower Low near $0.0570, and the current consolidation around $0.0574–$0.0578. A rising trendline connects the original Higher Low through the recent Lower Lows, still technically intact beneath the current range.
Momentum Is Genuinely Neutral
The RSI (14) is at 46.27, just below its moving average of 51.20 — both sitting almost exactly at the midpoint. That's about as neutral a momentum reading as this indicator produces, and it matches the sideways price action: no strong signal in either direction right now.
The Zone That Matters: $0.05641 – $0.05739
Current price is trading in this band. Holding above the rising trendline and this support zone keeps the broader structure intact; losing it would be the first real sign that the range is breaking down rather than just consolidating.
Resistance Levels to Watch
$0.0570 — a minor reference level within the recent range
$0.05879 — the more significant resistance; the level that's capped the two strongest rally attempts so far
Support Levels to Watch
$0.05641 — the nearer support
$0.05541 — a deeper support level
The rising trendline — currently running beneath the range; a break below it would be a meaningful structural change
Potential Trade Setups (Illustrative Only — Not Financial Advice)
🟢 Setup 1 — Buy the trendline retest
Entry zone: $0.0564 – $0.0574 (on a pullback toward the rising trendline and support)
Invalidation / Stop-loss: Below $0.0554
Target 1: $0.05879
Target 2: Open-ended above the high
🔴 Setup 2 — Fade a rejection at resistance
Trigger: Rejection candle near $0.05879
Entry zone: Top of the rejection
Invalidation / Stop-loss: Above $0.0592
Target 1: $0.05641
Target 2: $0.05541
🟢 Setup 3 — Bullish breakout
Trigger: A confirmed 15M close above $0.05879 with follow-through
Entry zone: $0.0588 – $0.0592 on confirmation
Invalidation / Stop-loss: Below $0.0570
Target: Open-ended
⚠️ Trendline breakdown (bearish invalidation)
A confirmed close below the rising trendline and $0.0554 would break the structure that's held since the original Higher Low, opening the door to a deeper retracement.
Bottom Line
MANTA is chopping sideways with genuinely neutral momentum, and the rising trendline beneath the current range remains the key structural reference. The $0.0564–$0.0574 zone is the level to watch: hold above the trendline and support, and this looks like healthy consolidation before another push at $0.05879; lose it, and the range would need to be reassessed.
Disclaimer: This content is for informational and educational purposes only and does not constitute financial, investment, or trading advice. Cryptocurrency trading involves significant risk, including the potential loss of principal. Past performance and chart patterns are not indicative of future results. Always conduct your own research and consult a licensed financial advisor before making trading decisions.
@Binance Earn Official @Binance Square Official #SpaceXSharesRiseTo$140 #SECReviewsSix3xLeveragedCommodityETFs #USToPressNationsToPickUSOrChinaAICoalition #Binance #ChartSniper