🔥 $HEI / USDT: مسح سيولة عبر 1H & اختبار دعم SMC عند $0.1350
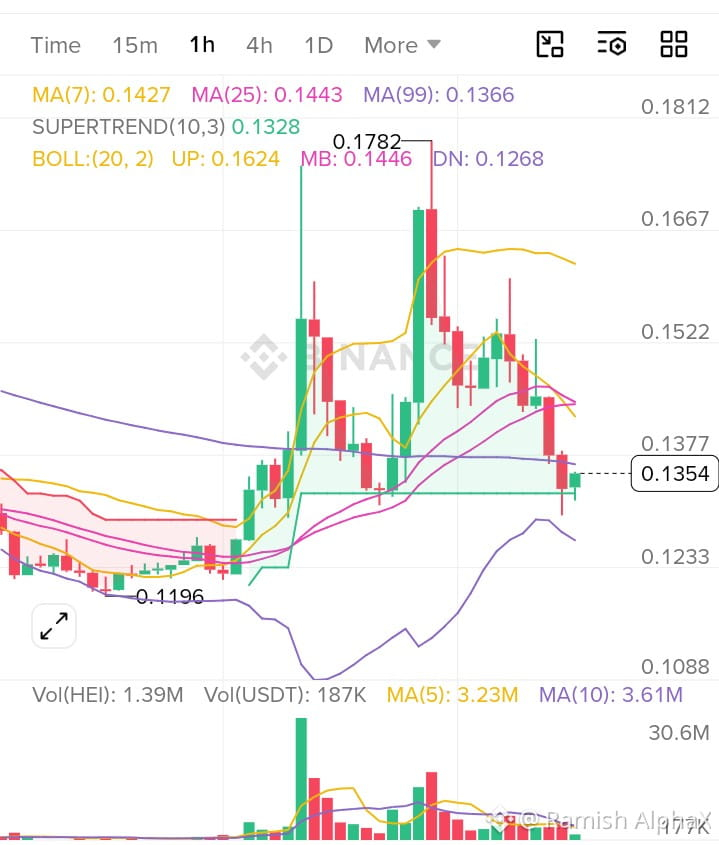
يعرض مخطط الساعة الواحدة (1H) لِـ $HEI /USDT توسّعًا متقلبًا دفع السعر حتى $0.1782، تلاه تحرك عدّي سريع على الأطر الزمنية الأصغر نزولًا إلى $0.1354. السعر حاليًا يختبر منطقة طلب رئيسية تتقاطع فيها عدة عوامل مع خط الأساس الديناميكي للسوبرترند.
📊 اتجاه السوق: محايد إلى صاعد (تخفيف منطقة الطلب)
تحليل الاتجاه: على مخطط 1H، يقوم HEI بالارتداد بعد مسح لسيولة الشراء عند $0.1782. انخفض السعر تحت متوسط 1H المتحرك (7) ($0.1427) ومتوسط 1H المتحرك (25) ($0.1443)، لكنه ما يزال ثابتًا مباشرةً فوق مستوى دعم متوسط 1H المتحرك (99) ($0.1366) ودعم Supertrend(10,3) ($0.1328). يشير تراجع حجم البيع إلى احتمال تشكّل قاع محلي.
🎯 إعداد التداول: LONG (إعادة اختبار منطقة الطلب & استعادتها)
الإجراء: افتح LONG عند هبوط خفيف إلى منطقة POI في الذيل السفلي، أو عند إغلاق مؤكد على 1H يعود فوق $0.1427 (استعادة MA(7)).
منطقة الدخول: $0.1320 – $0.1370 (تقاطُع مع 1H Supertrend $0.1328 و MA(99) $0.1366 ومنطقة النطاق السفلي لبولينجر $0.1268)
وقف الخسارة (SL): $0.1250 (موضوع بأمان أسفل حدّ النطاق السفلي لبولينجر ودعم التذبذب الرئيسي)
جني الربح 1 (TP1): $0.1445 (إعادة اختبار 1H MA(25) & منتصف Bollinger)
جني الربح 2 (TP2): $0.1624 (هدف النطاق العلوي لبولينجر في 1H)
جني الربح 3 (TP3): $0.1780 (أعلى مستوى محلي في 1H / مستوى مسح BSL)
المخاطرة:العائد (R:R): ~1:2.3 (حتى TP2)
إبطال الصفقة: إغلاق شمعة 1H مستمر تحت $0.1250 يكسر دعم البنية ويلغي الإعداد.
#HEI #HEİ #HEIUSDT #HEİUSDT #HEICoin
يعرض مخطط الساعة الواحدة (1H) لِـ $HEI /USDT توسّعًا متقلبًا دفع السعر حتى $0.1782، تلاه تحرك عدّي سريع على الأطر الزمنية الأصغر نزولًا إلى $0.1354. السعر حاليًا يختبر منطقة طلب رئيسية تتقاطع فيها عدة عوامل مع خط الأساس الديناميكي للسوبرترند.
📊 اتجاه السوق: محايد إلى صاعد (تخفيف منطقة الطلب)
تحليل الاتجاه: على مخطط 1H، يقوم HEI بالارتداد بعد مسح لسيولة الشراء عند $0.1782. انخفض السعر تحت متوسط 1H المتحرك (7) ($0.1427) ومتوسط 1H المتحرك (25) ($0.1443)، لكنه ما يزال ثابتًا مباشرةً فوق مستوى دعم متوسط 1H المتحرك (99) ($0.1366) ودعم Supertrend(10,3) ($0.1328). يشير تراجع حجم البيع إلى احتمال تشكّل قاع محلي.
🎯 إعداد التداول: LONG (إعادة اختبار منطقة الطلب & استعادتها)
الإجراء: افتح LONG عند هبوط خفيف إلى منطقة POI في الذيل السفلي، أو عند إغلاق مؤكد على 1H يعود فوق $0.1427 (استعادة MA(7)).
منطقة الدخول: $0.1320 – $0.1370 (تقاطُع مع 1H Supertrend $0.1328 و MA(99) $0.1366 ومنطقة النطاق السفلي لبولينجر $0.1268)
وقف الخسارة (SL): $0.1250 (موضوع بأمان أسفل حدّ النطاق السفلي لبولينجر ودعم التذبذب الرئيسي)
جني الربح 1 (TP1): $0.1445 (إعادة اختبار 1H MA(25) & منتصف Bollinger)
جني الربح 2 (TP2): $0.1624 (هدف النطاق العلوي لبولينجر في 1H)
جني الربح 3 (TP3): $0.1780 (أعلى مستوى محلي في 1H / مستوى مسح BSL)
المخاطرة:العائد (R:R): ~1:2.3 (حتى TP2)
إبطال الصفقة: إغلاق شمعة 1H مستمر تحت $0.1250 يكسر دعم البنية ويلغي الإعداد.
#HEI #HEİ #HEIUSDT #HEİUSDT #HEICoin