🚨 مراقبة الفخ بواسطة Noor Trades: @BitEagle News $SOL تحليل المكالمات 📉
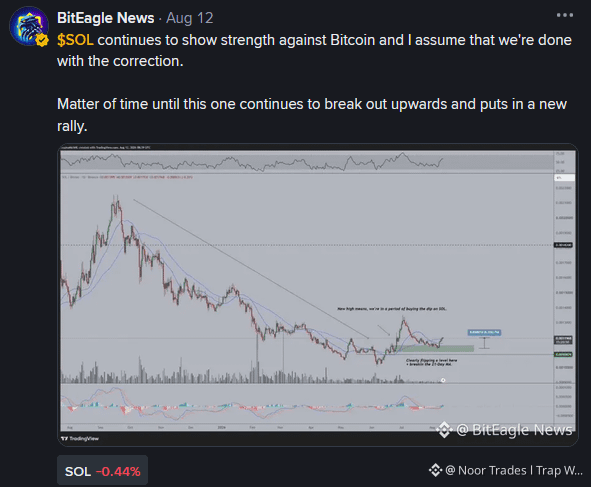
@BitEagle News يدّعي $SOL أنها اكتملت مع تصحيحها مقابل البيتكوين وهي جاهزة لـ "الاختراق للأعلى والبدء في موجة جديدة." لكن هذا هو الفخ الفني وراء هذا الرسم البياني 👇
🚨 العيب رقم 1: مقاومة خط اتجاه هابط ما زالت قائمة
البنية الكلية على مخطط SOL/BTC ما زالت ضمن قناة هابطة نظيفة تتميز بالقِمم الأقل. السعر يتفاعل حاليًا مباشرة عند مقاومة خط الاتجاه الهابط طويل الأجل، ما يجعل الدخول الطويل من هنا مخاطرة عالية وسبقًا غير محسوب.
🚨 العيب رقم 2: قمة محلية أعلى ضعيفة & حجم متناقص
يُظهر الرسم ارتدادًا محليًا صغيرًا موسومًا بـ "القمة الجديدة تعني أننا في فترة شراء للانخفاض." لكن هذه القمة المحلية فشلت في استعادة مستويات البنية الرئيسية السابقة للسوق، كما أن الحجم ينخفض بثبات أثناء الدفع للأعلى.
🚨 العيب رقم 3: إنهاء التصحيح الكلي مبكرًا جدًا
افتراض أن التصحيح "انتهى" دون كسر واضح في بنية السوق (MSB) أو تأكيد أعلى-منخفض أعلى-مرتفع (higher-low higher-high) فوق مجموعة المتوسطات المتحركة الرئيسية غالبًا ما يدفع متداولي التجزئة مباشرة إلى فخ بول.
💡 الخلاصة الرئيسية: لا تشترِ مباشرة عند خطوط الاتجاه الهابطة طويلة الأجل على افتراض أن الاختراق سيحدث. انتظر إغلاقًا يوميًا واضحًا فوق خط الاتجاه ثم أعد الاختبار قبل الدخول. حماية رأس المال > توقع الاختراقات!
👇 ما خطتك تجاه $SOL الآن؟ 🟢 دخول شراء مع الهبوط | 🔴 انتظار تأكيد خط الاتجاه
@BitEagle News يدّعي $SOL أنها اكتملت مع تصحيحها مقابل البيتكوين وهي جاهزة لـ "الاختراق للأعلى والبدء في موجة جديدة." لكن هذا هو الفخ الفني وراء هذا الرسم البياني 👇
🚨 العيب رقم 1: مقاومة خط اتجاه هابط ما زالت قائمة
البنية الكلية على مخطط SOL/BTC ما زالت ضمن قناة هابطة نظيفة تتميز بالقِمم الأقل. السعر يتفاعل حاليًا مباشرة عند مقاومة خط الاتجاه الهابط طويل الأجل، ما يجعل الدخول الطويل من هنا مخاطرة عالية وسبقًا غير محسوب.
🚨 العيب رقم 2: قمة محلية أعلى ضعيفة & حجم متناقص
يُظهر الرسم ارتدادًا محليًا صغيرًا موسومًا بـ "القمة الجديدة تعني أننا في فترة شراء للانخفاض." لكن هذه القمة المحلية فشلت في استعادة مستويات البنية الرئيسية السابقة للسوق، كما أن الحجم ينخفض بثبات أثناء الدفع للأعلى.
🚨 العيب رقم 3: إنهاء التصحيح الكلي مبكرًا جدًا
افتراض أن التصحيح "انتهى" دون كسر واضح في بنية السوق (MSB) أو تأكيد أعلى-منخفض أعلى-مرتفع (higher-low higher-high) فوق مجموعة المتوسطات المتحركة الرئيسية غالبًا ما يدفع متداولي التجزئة مباشرة إلى فخ بول.
💡 الخلاصة الرئيسية: لا تشترِ مباشرة عند خطوط الاتجاه الهابطة طويلة الأجل على افتراض أن الاختراق سيحدث. انتظر إغلاقًا يوميًا واضحًا فوق خط الاتجاه ثم أعد الاختبار قبل الدخول. حماية رأس المال > توقع الاختراقات!
👇 ما خطتك تجاه $SOL الآن؟ 🟢 دخول شراء مع الهبوط | 🔴 انتظار تأكيد خط الاتجاه