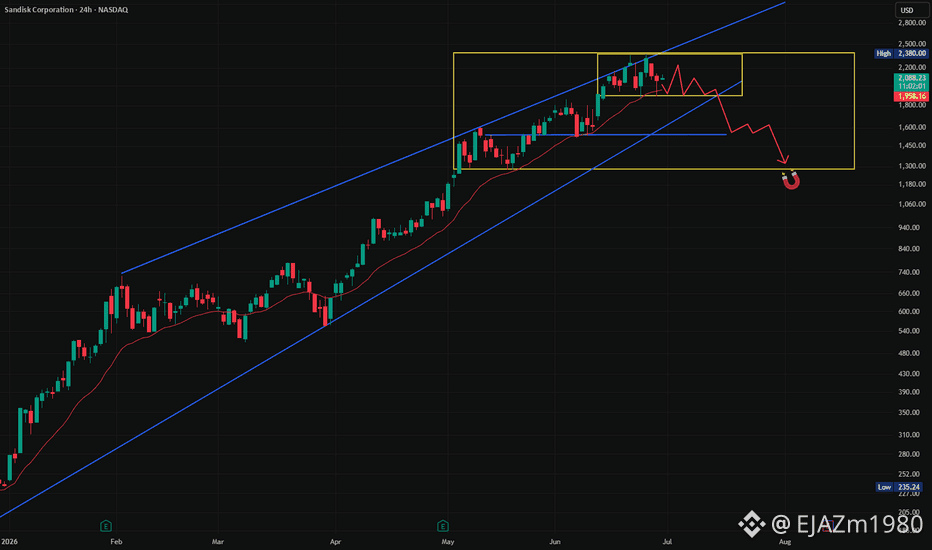
SNDK Candle Chart:
SNDK remains in a strong overall uptrend, but the candles are showing rejection near the 2,200–2,300 resistance zone. If price breaks and holds above 2,300, the bullish trend could continue. A breakdown below 1,900 could trigger a deeper pullback toward 1,500–1,300.
Short-term bias: ⚠️ Bearish/pullback risk.
Key resistance: 2,200–2,300
Key support: 1,900, then 1,500–1,300. $SNDK.US
SNDK remains in a strong overall uptrend, but the candles are showing rejection near the 2,200–2,300 resistance zone. If price breaks and holds above 2,300, the bullish trend could continue. A breakdown below 1,900 could trigger a deeper pullback toward 1,500–1,300.
Short-term bias: ⚠️ Bearish/pullback risk.
Key resistance: 2,200–2,300
Key support: 1,900, then 1,500–1,300. $SNDK.US