
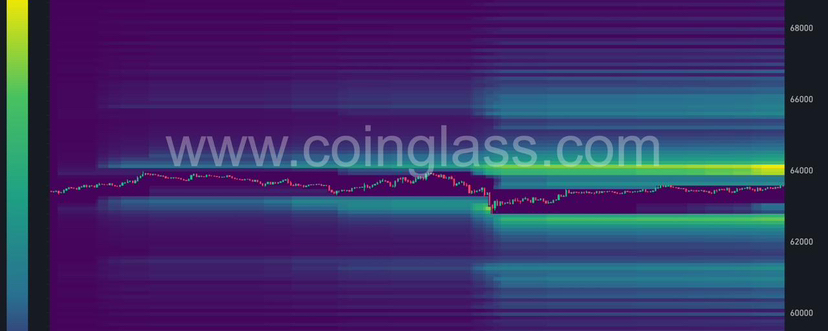

BITCOIN LIQUIDATION HEATMAP UPDATE
Bitcoin is currently trading around the $63,500 area, and the liquidation maps are showing a very clear battle zone developing between stacked liquidity above and below price.
Looking across the 12-hour, 24-hour, and 3-day heatmaps, the main takeaway is that liquidity is currently concentrated on both sides of the market, but the nearest major pools are sitting slightly above current price.
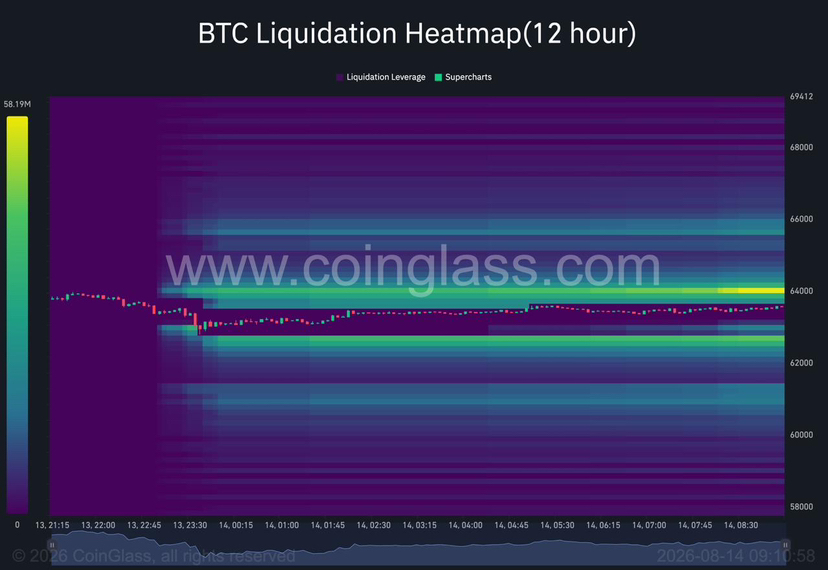
Short-term liquidity (12H)
The 12-hour heatmap shows the strongest nearby liquidity cluster sitting around:
$64,000 - $64,300
This area has consistently acted as a magnet for price, with a large amount of short-side liquidation liquidity building above the current range.
A move back above $64K would likely trigger a squeeze higher as late shorts begin to get forced out.
Above that, the next notable liquidity zone sits around:
$65,500 - $66,000
This lines up with the resistance zone we have been watching from technical structure.
For downside liquidity, the strongest nearby pool sits around:
$62,500 - $62,800
This area has already attracted price once, but liquidity remains below as traders continue placing stops underneath recent lows.
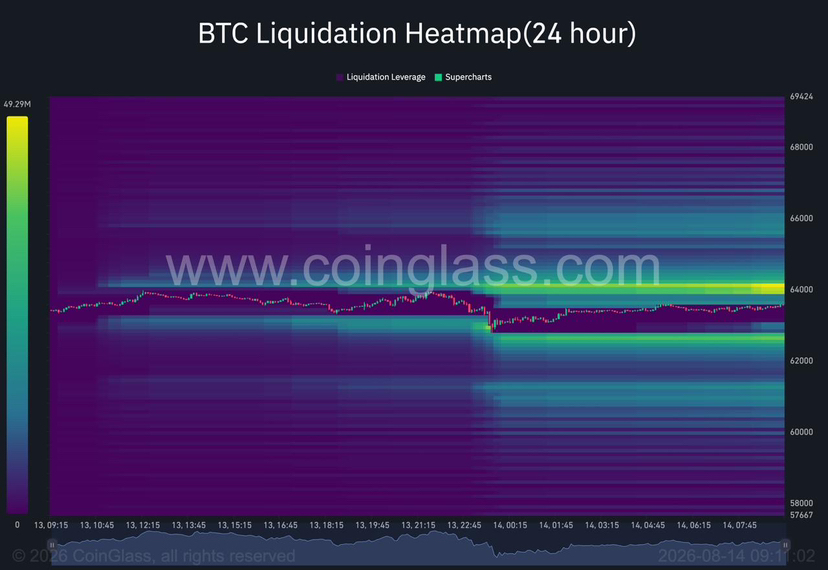
24-hour heatmap
The 24-hour map gives a similar picture.
Bitcoin has been consolidating between roughly:
$63,000 - $64,000
and liquidity is building around the edges of this range.
The important observation:
Price has repeatedly defended the $63K region, meaning sellers have not been able to create a clean breakdown despite multiple attempts.
However, buyers are also struggling to reclaim $64K convincingly.
This creates a compressed range where the next liquidity sweep is likely to determine the next directional move.
3-day heatmap
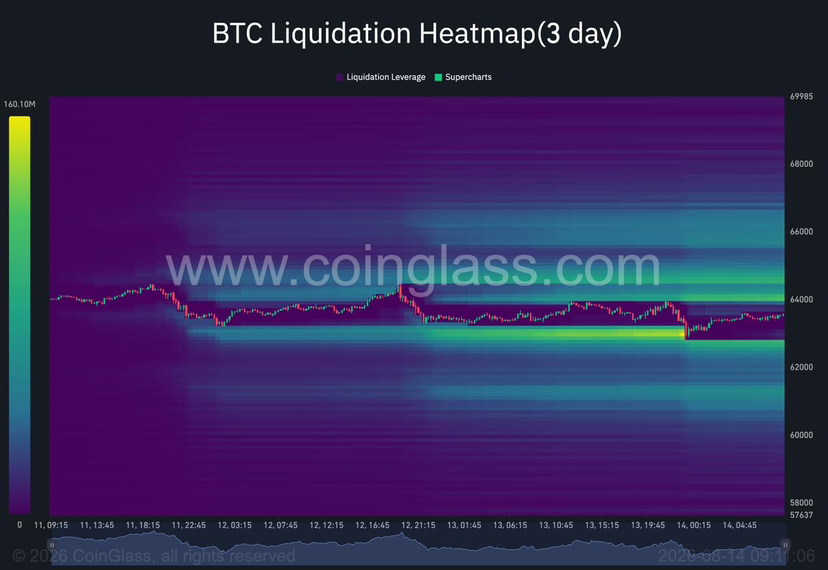
The higher timeframe heatmap gives us the bigger picture.
The largest liquidity pockets are sitting around:
Upside:
$65,500 - $66,500
Downside:
$62,000 - $62,500
This tells us the market is currently trapped between two major liquidation zones.
The longer Bitcoin stays inside this range, the more liquidity builds on both sides, increasing the probability of a sharp move once one side gets taken.
What this means for Bitcoin
Right now, the market is not showing signs of a confirmed breakdown.
Instead, Bitcoin appears to be building liquidity for the next expansion move.
The key level remains:
$64,000
A reclaim and hold above this level would likely open the door towards:
$65,700 → $66,500
as shorts above the range become vulnerable.
However, losing:
$63,000
would expose the downside liquidity cluster around:
$62,000 - $62,500
where we would expect buyers to attempt another defence.
CHR Market Bias
The current structure suggests Bitcoin is in a liquidity accumulation phase.
We are watching for a sweep rather than chasing moves inside the range.
The most likely scenario:
A push towards the upside liquidity around $64K-$65.7K to clear short positioning, followed by a decision on whether buyers have enough strength for continuation.
Until Bitcoin loses $63K, the higher probability remains a range expansion to the upside.
Key levels:
Resistance:
$64,000
$65,700
$66,500
Support:
$63,000
$62,500
$61,000
Liquidity is building. The next move is likely to be aggressive.