

Key Highlights
Bitcoin's Average Directional Index (ADX) has dropped to its lowest level in over two years — signaling that the current consolidation range near $63,200–$63,500 is one of the most prolonged and mature range-bound phases in recent Bitcoin history.
The 7-day Historical Volatility Index (BVOL7D) has compressed to 2.89 — near the lowest reading of the entire 2023–2026 period — a level that has historically preceded aggressive volatility expansion.
Neither indicator signals direction — both signal the same thing: Bitcoin is coiling tightly, and a significant directional move is increasingly overdue.
Bitcoin has been doing something unusual for an asset known for dramatic price swings: almost nothing. Price has been grinding in the $63,200–$63,500 range through another session of limited movement, and two independent technical indicators are now both quantifying just how historically extreme this period of market dormancy has become.
The message from both is identical — not bullish, not bearish, but unambiguous: Bitcoin has been this quiet before, and it has never stayed that way.
Signal 1 — ADX at a 2-Year Low: The Trend Has Gone to Sleep
The first signal comes from on-chain and technical analyst Darkfost (@Darkfost_Coc), who flagged that Bitcoin’s Average Directional Index (ADX) has just dropped to its lowest value in more than two years.
What the ADX Actually Measures
The ADX is one of the most misunderstood tools in technical analysis — and understanding what it does and does not measure is essential for interpreting the current signal correctly.
The ADX is a non-directional indicator. It does not tell you whether Bitcoin is going up or down. It measures one thing only: how strong the current trend is, regardless of direction. A high ADX reading means a strong trend is in place — up or down. A low ADX reading means the market lacks directional conviction and is operating in a range.
The current ADX reading at a 2-year low means Bitcoin’s trend strength has compressed to the weakest level seen since mid-2024 — a period that preceded one of the more significant directional moves in Bitcoin’s recent history.
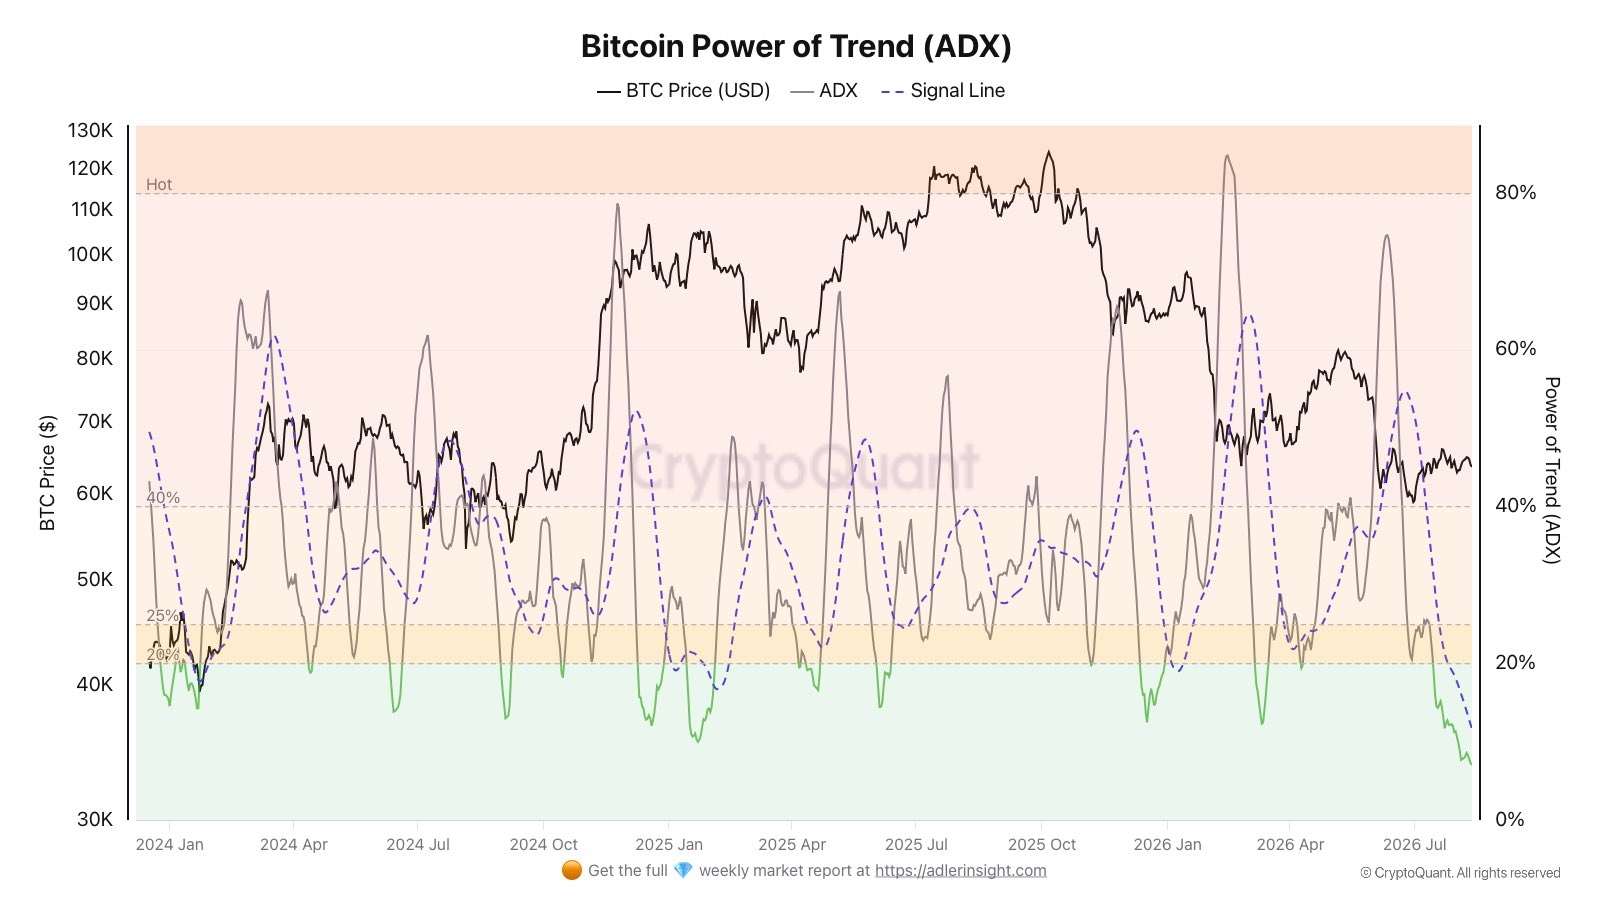
Bitcoin Power of Trend (ADX) /Source: @Darkfost_Coc X)
What a Low ADX Environment Signals
Darkfost’s analysis frames the current low-ADX environment through the lens of cycle dynamics rather than short-term trading signals. The key observation: a prolonged low-ADX environment means the current range is aging. Markets do not stay in tight consolidation indefinitely — and the longer a low-ADX phase persists, the more energy is typically being stored for the eventual directional resolution.
Darkfost notes that multiple other indicators are pointing toward the same conclusion: the market has been “lulled to sleep” for several months, and a significant move may be approaching. The ADX is not providing the catalyst or the direction — it is providing the historical context that makes the current quiet phase analytically meaningful rather than random noise.
As covered in our Bitcoin macro bottom signals analysis and ADCI accumulation zone analysis, the on-chain and macro technical picture for Bitcoin in August 2026 has been accumulating signals that collectively describe a market at or near an inflection point. The ADX reading adds the trend-strength dimension to that picture.
Signal 2 — BVOL7D at 2.89: Volatility Compressed to a Coil
The second signal comes from analyst Klintoshi (@Klintoo), who highlighted that Bitcoin’s 7-day Historical Volatility Index (BVOL7D) has compressed to 2.89 — sitting near the lowest level of the entire 2023–2026 period.
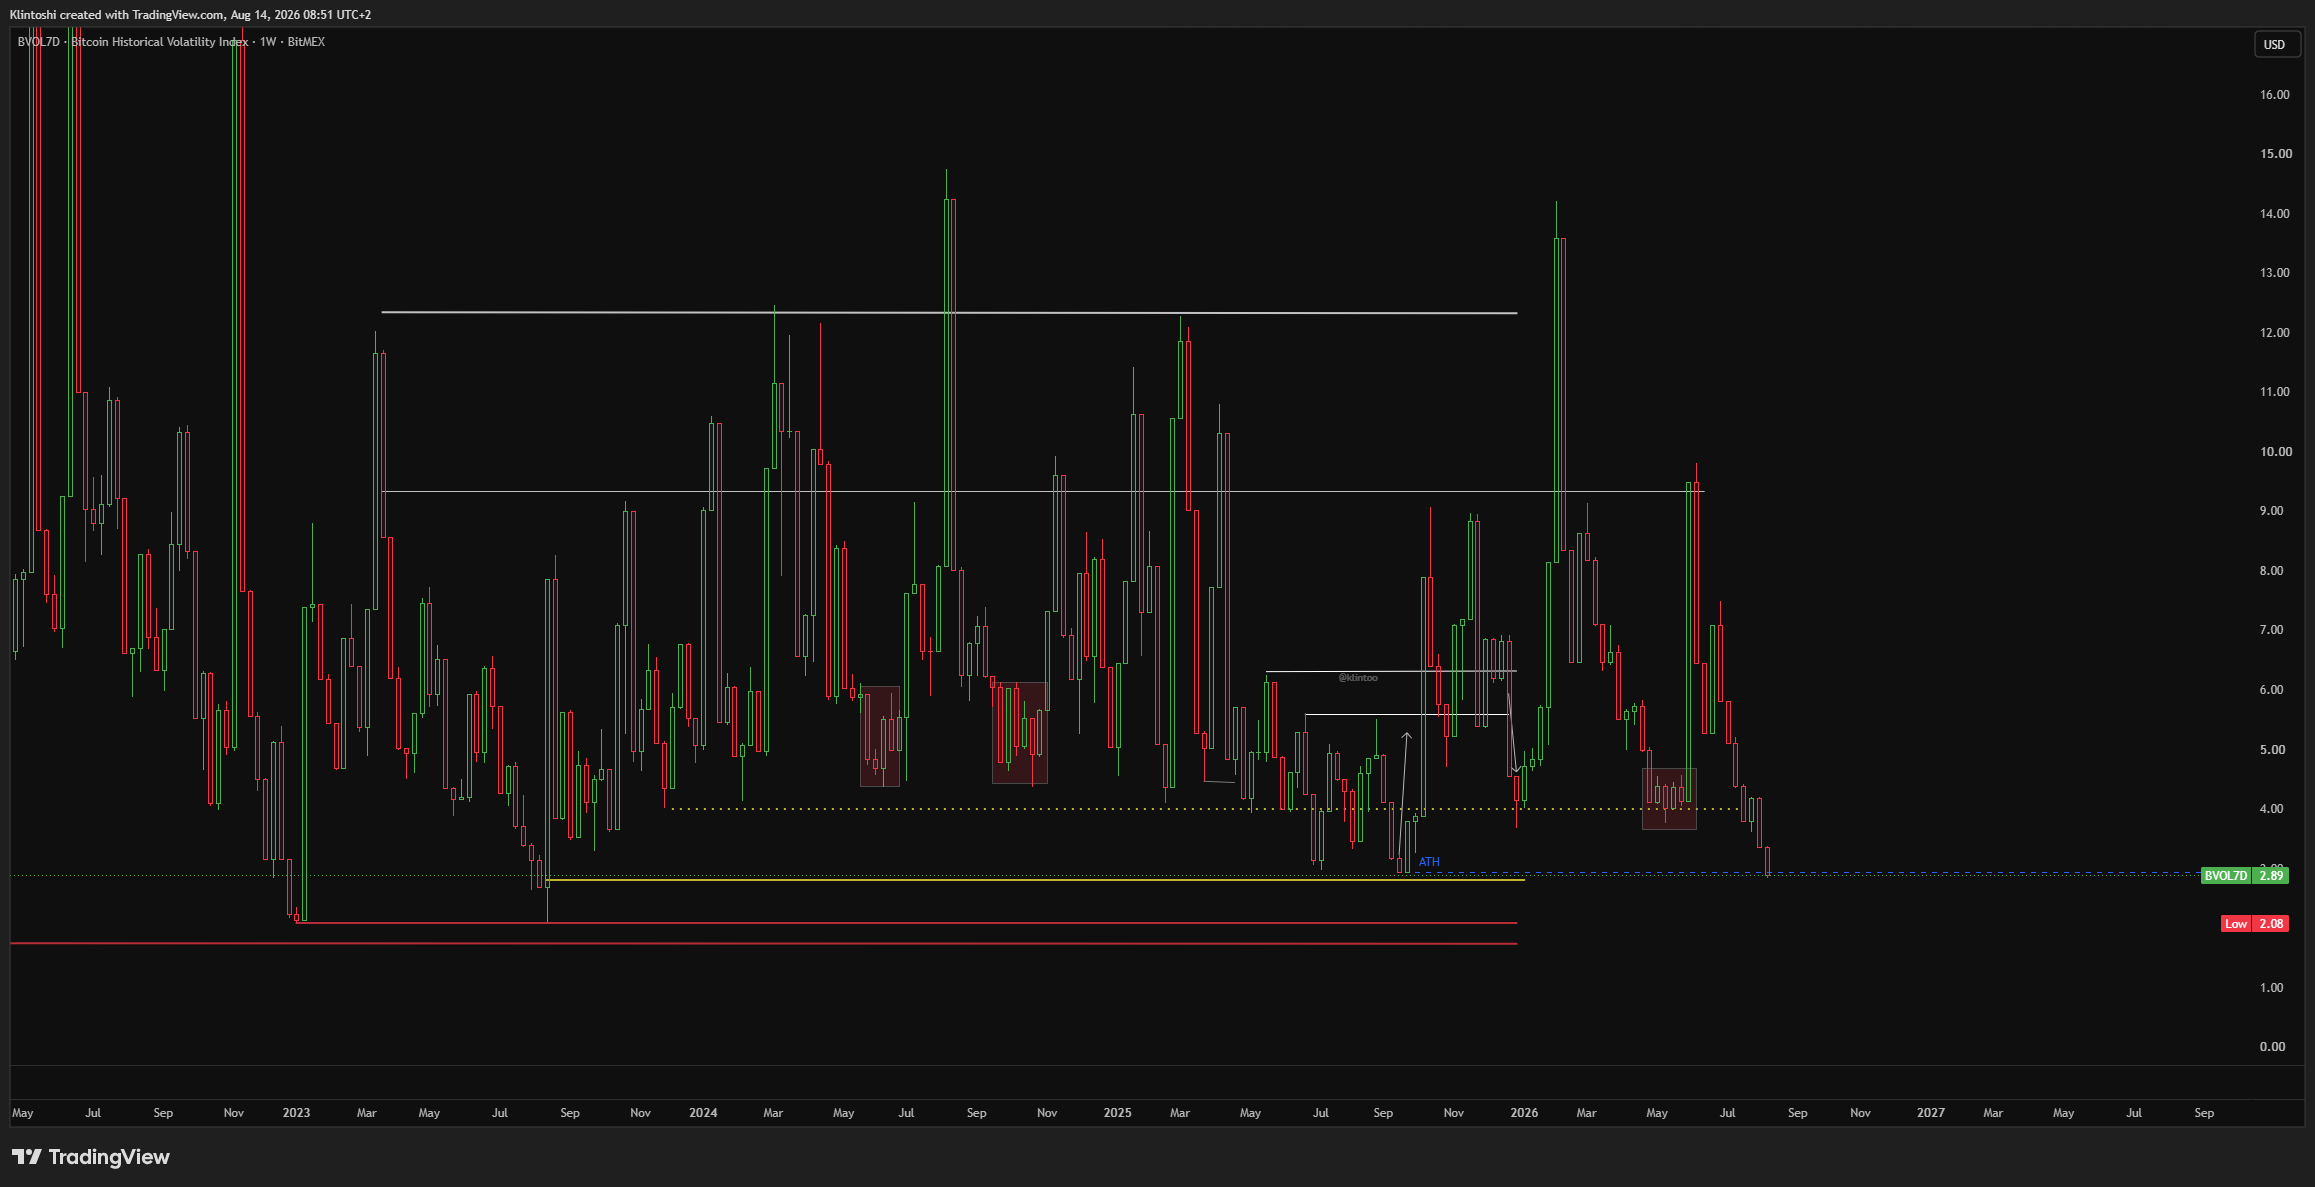
Bitcoin Historical Volatility Index/Source: @Klintoo (X)
What Historical Volatility Compression Means
Historical volatility measures how much Bitcoin’s price has actually moved over a defined recent period — in this case, the past 7 days. A BVOL7D reading of 2.89 means Bitcoin has been moving with almost no measurable momentum across that window — one of the tightest price compression readings the asset has produced in years.
Volatility compression of this magnitude is best understood through a physics analogy: a spring being compressed. The longer and more completely it is compressed, the more force is stored — and the more powerful the release when the compression ends. Bitcoin’s 2.89 BVOL7D reading describes a spring that has been compressed for an unusually long time.
The Historical Pattern
Klintoshi’s analysis identifies a consistent pattern in Bitcoin’s volatility history: previous instances of BVOL7D compression to these extreme low levels were followed by aggressive volatility expansion. Not gradual increases in movement — aggressive expansion that characterized the beginning of significant directional moves.
The critical qualifier, as Klintoshi notes explicitly, is that this reading does not indicate direction. Volatility expansion can resolve in either direction — the compressed spring releases upward or downward depending on the catalyst that breaks the equilibrium. What the BVOL7D at 2.89 tells us is not where Bitcoin is going — it is that the quiet will not last, and when it ends, the move will likely be significant.
Why Two Non-Directional Signals Together Are More Powerful Than One
Taken individually, each signal carries weight. Taken together, they carry considerably more.
The ADX at a 2-year low and the BVOL7D at 2.89 are measuring the same underlying market condition from two different analytical frameworks — one through the lens of trend strength, one through the lens of price movement magnitude. When two independent tools that measure different dimensions of market activity both reach historically extreme low readings simultaneously, the probability that the current quiet phase is genuinely anomalous — rather than simply a normal quiet period — increases substantially.
The combined reading describes a Bitcoin market that is:
Not trending (ADX at 2-year low)
Not moving (BVOL7D at 2023–2026 low)
Historically overdue for a resolution (both indicators at extremes simultaneously)
As covered in our Bitcoin LTH profitability cycle bottom analysis and Bitcoin whale accumulation pre-CPI analysis, the macro on-chain signals building through August 2026 have been pointing toward an inflection point. The ADX and BVOL7D readings add the technical volatility and trend-strength confirmation to what the on-chain data has already been suggesting.
What Triggers the Break — And What to Watch
The ADX and BVOL7D readings tell us the setup is mature. They do not tell us the catalyst. But understanding what has historically broken Bitcoin out of similar consolidation environments provides a practical framework for what to monitor.
Macro data releases: The July CPI print (August 12) delivered a soft result without providing enough catalyst to break the range. The Federal Reserve’s next policy signals, additional inflation data, or significant macro developments could serve as the trigger that ends the current low-volatility phase.
On-chain demand shift: As covered in our Bitcoin futures vs. spot demand CryptoQuant heatmap analysis, spot demand has remained net negative while futures activity builds. A rotation of spot demand into positive territory would represent the organic buying pressure shift most consistent with a bullish volatility expansion.
Liquidation cluster resolution: The $64,800–$65,500 short liquidation zone and $62,800–$63,200 long liquidation zone identified in recent analysis remain the immediate price-level triggers. A decisive break into either cluster would initiate the cascade dynamics that tend to amplify moves out of prolonged consolidation.
Institutional flow acceleration: A spike in Bitcoin ETF inflows — particularly in spot rather than futures vehicles — would represent the kind of demand-side catalyst that historically accompanies the early stages of volatility expansion from compressed readings.
Bullish vs. Bearish Scenarios
Bullish Scenario
A macro or on-chain catalyst pushes BTC above the $64,800–$65,500 short liquidation zone, triggering the short squeeze dynamics that amplify the initial move. The ADX begins climbing from its 2-year low — confirming that a new directional trend is establishing — while the BVOL7D expands rapidly from 2.89 as price momentum returns. The combination of historically extreme volatility compression resolving to the upside with on-chain whale accumulation (documented throughout August) providing the structural bid creates conditions for a move toward the $68,000–$70,000 range as the initial post-breakout target.
Bearish Scenario
Selling pressure overwhelms the consolidation equilibrium, pushing BTC below the $62,800–$63,200 long liquidation zone and triggering cascading long liquidations. The ADX begins rising from its low — but in the context of a downtrend rather than an uptrend — while BVOL7D expands to the downside. In this scenario, the $60,000 psychological level and the $58,000–$59,000 range become the immediate support references. The macro accumulation signals (ADCI at 21.74, LTH profitability at cycle lows) would remain structurally intact but would require lower prices and more time to resolve bullishly.
Bottom Line
Bitcoin’s ADX at a 2-year low and BVOL7D at 2.89 are not ambiguous signals — they are among the clearest quantitative descriptions of an unusually prolonged market consolidation that Bitcoin’s technical toolkit can produce. Two independent indicators measuring different dimensions of market activity have both reached historically extreme readings simultaneously, describing a market that is coiling rather than trending and compressing rather than expanding.
The setup is mature. The direction is unknown. The eventual move — when the consolidation resolves — is historically likely to be significant. For traders and investors, the current environment is less about predicting direction and more about being positioned for the volatility expansion that both indicators are quantifying as increasingly overdue.
$64,800 to the upside and $62,800 to the downside remain the immediate levels that will define which direction the coil releases — and when one of those levels breaks with conviction, the ADX and BVOL7D readings suggest the move that follows is unlikely to be modest.
Disclaimer: The views and analysis presented in this article are for informational purposes only and reflect the author’s perspective, not financial advice. Technical patterns and indicators discussed are subject to market volatility and may or may not yield the anticipated results. Investors are advised to exercise caution, conduct independent research, and make decisions aligned with their individual risk tolerance.