$BTC نظرة سريعة (اعتبارًا من 13 أغسطس 2026):
تتداول عملة البيتكوين حاليًا قرب 63,558 دولارًا، منخفضة من مستوى مرتفع محلي فوق 65,300 دولار في وقت سابق من هذا الأسبوع. وهي الآن تقريبًا أقل بنسبة 48–50% من أعلى مستوى لها على الإطلاق البالغ 126,080 دولارًا (أكتوبر 2025)، وبفارق يقارب 59,700 دولار عن عام مضى — تراجع إجمالي ممتد.
ما الذي يدفع ذلك:
دفعت بيانات وظائف ضعيفة في يوليو (انخفضت الوظائف بمقدار 23,000 وظيفة، مع وصول معدل البطالة إلى 4.1%) في البداية البيتكوين إلى الارتفاع عبر تفاؤل احتمالات خفض الفائدة، حيث كانت الأسواق تسعّر نحو 56% من احتمالات الإبقاء على الفائدة من جانب بنك الاحتياطي الفيدرالي في 16 سبتمبر.
لكن البيتكوين تراجعت منذ 10–11 أغسطس بعد أن تحولت الاهتمامات الكلية إلى بيانات التضخم (CPI) وحركات أسعار النفط التي أعادت إشعال مخاوف التضخم — وهو عامل سلبي للأصول ذات المخاطر.
شهدت صناديق البيتكوين المتداولة الفورية (Spot Bitcoin ETFs) تدفقات واردة متواضعة فقط (7.8 مليون دولار)، ما يشير إلى فتور شهية المستثمرين المؤسسيين حاليًا.
تقع القيمة السوقية قرب 1.3 تريليون دولار، وما زالت تمثل حوالي 57% من إجمالي حصة سوق العملات الرقمية.
الخلاصة: البيتكوين عالقة بين تفاؤل خفض الفائدة وقلق التضخم — تحركات سعرية متذبذبة مدفوعة بعوامل الاقتصاد الكلي أكثر من كونها اتجاهًا واضحًا. هذه مجرد تعليقات سوقية وليست نصيحة مالية — يُنصح بإجراء بحثك الخاص قبل اتخاذ أي قرار.
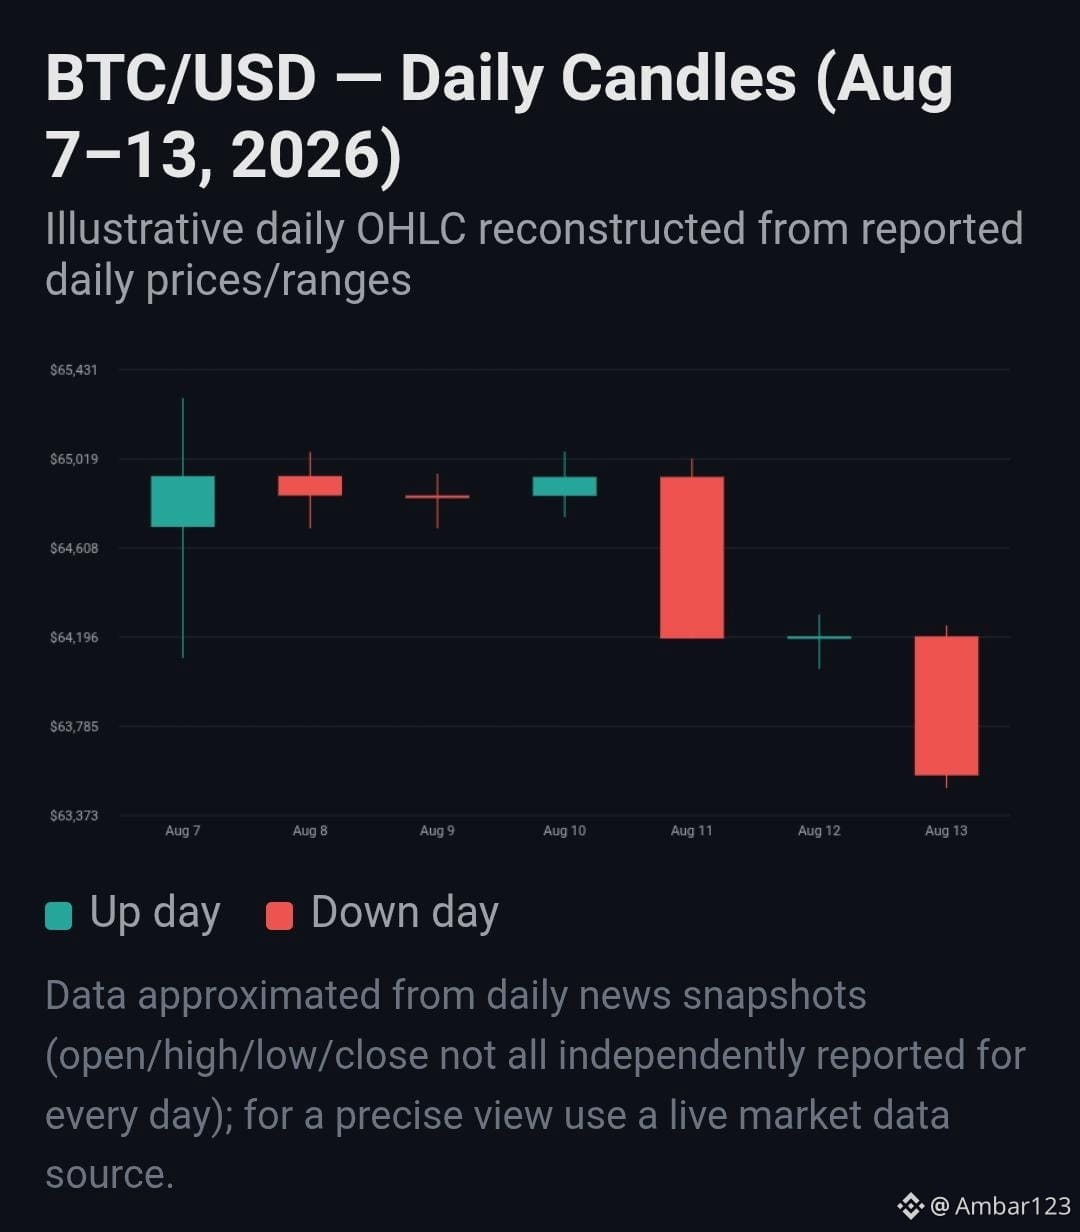
يوضح مخطط الشموع أعلاه النمط اليومي للفترة من 7 إلى 13 أغسطس (ملاحظة: تم إعادة بنائه اعتمادًا على لقطات يومية للسعر وليس بيانات OHLC الدقيقة، لذا اعتبره توضيحيًا للاتجاه الهبوطي الأخير وليس مطابقًا لحظات التداول بدقة).
#BTC #Bitcoin #Crypto #Cryptocurrency #BitcoinPrice #BTCUSD #CryptoMarket #Blockchain #DigitalCurrency
تتداول عملة البيتكوين حاليًا قرب 63,558 دولارًا، منخفضة من مستوى مرتفع محلي فوق 65,300 دولار في وقت سابق من هذا الأسبوع. وهي الآن تقريبًا أقل بنسبة 48–50% من أعلى مستوى لها على الإطلاق البالغ 126,080 دولارًا (أكتوبر 2025)، وبفارق يقارب 59,700 دولار عن عام مضى — تراجع إجمالي ممتد.
ما الذي يدفع ذلك:
دفعت بيانات وظائف ضعيفة في يوليو (انخفضت الوظائف بمقدار 23,000 وظيفة، مع وصول معدل البطالة إلى 4.1%) في البداية البيتكوين إلى الارتفاع عبر تفاؤل احتمالات خفض الفائدة، حيث كانت الأسواق تسعّر نحو 56% من احتمالات الإبقاء على الفائدة من جانب بنك الاحتياطي الفيدرالي في 16 سبتمبر.
لكن البيتكوين تراجعت منذ 10–11 أغسطس بعد أن تحولت الاهتمامات الكلية إلى بيانات التضخم (CPI) وحركات أسعار النفط التي أعادت إشعال مخاوف التضخم — وهو عامل سلبي للأصول ذات المخاطر.
شهدت صناديق البيتكوين المتداولة الفورية (Spot Bitcoin ETFs) تدفقات واردة متواضعة فقط (7.8 مليون دولار)، ما يشير إلى فتور شهية المستثمرين المؤسسيين حاليًا.
تقع القيمة السوقية قرب 1.3 تريليون دولار، وما زالت تمثل حوالي 57% من إجمالي حصة سوق العملات الرقمية.
الخلاصة: البيتكوين عالقة بين تفاؤل خفض الفائدة وقلق التضخم — تحركات سعرية متذبذبة مدفوعة بعوامل الاقتصاد الكلي أكثر من كونها اتجاهًا واضحًا. هذه مجرد تعليقات سوقية وليست نصيحة مالية — يُنصح بإجراء بحثك الخاص قبل اتخاذ أي قرار.
يوضح مخطط الشموع أعلاه النمط اليومي للفترة من 7 إلى 13 أغسطس (ملاحظة: تم إعادة بنائه اعتمادًا على لقطات يومية للسعر وليس بيانات OHLC الدقيقة، لذا اعتبره توضيحيًا للاتجاه الهبوطي الأخير وليس مطابقًا لحظات التداول بدقة).
#BTC #Bitcoin #Crypto #Cryptocurrency #BitcoinPrice #BTCUSD #CryptoMarket #Blockchain #DigitalCurrency