
DODOX/USDT Perpetual · 4H Chart with RSI · Structure & Fair Value Gap Analysis
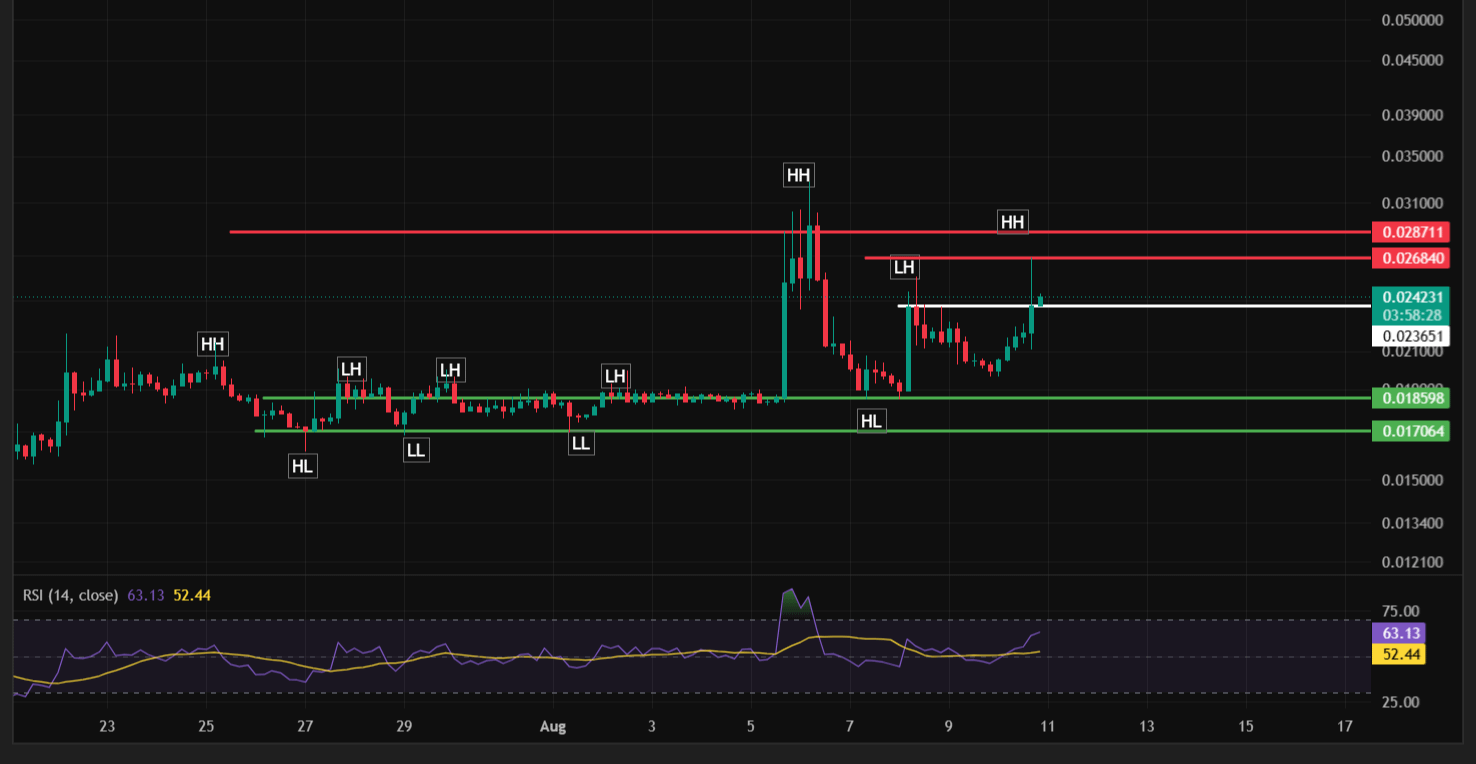
DODOX has had an eventful two and a half weeks — a long stretch of range-bound trading with a pattern of Lower Highs, followed by a sudden, explosive spike to $0.028711 on August 6 that was just as quickly given back in a sharp crash to $0.017. Since that crash, the coin has been rebuilding, and it's currently testing $0.023651 after a solid recovery push, with RSI at a moderately bullish 51.64–60.27 and rising.
Reading the Structure
Before the spike, DODOX spent nearly two weeks chopping in a range defined by a series of Lower Highs — a bounce to $0.021 (Jul 28–29), a weaker bounce to $0.0195 (Aug 1–2), and another to $0.021 (Aug 3–5) — each one failing to exceed the prior high, while Higher Lows and Lower Lows oscillated around $0.0175. That range-bound, slightly bearish structure was interrupted abruptly by the HH spike to $0.028711 on August 6, a move that gained roughly 30% before reversing just as sharply into a Higher Low near $0.017.
Since that low, the recovery has been more constructive:
A rally off $0.017 pushed into a Lower High near $0.024 (Aug 8–9).
A pullback held above the prior structure, and the current push has carried price back to $0.023651, with RSI confirming renewed momentum rather than just a price bounce.
This looks like a genuine recovery attempt rather than a simple relief bounce, but it's happening well below both the spike high and the resistance shelf just above current price — meaning there's real work left to do before this becomes a confirmed trend change.
Key Levels to Watch
Resistance:
$0.023651 — the immediate ceiling currently being tested.
$0.026840 — the more significant resistance level, the Lower High from the post-spike decline; clearing this would be a meaningful step toward reversing the broader Lower-High pattern.
$0.028711 — the major resistance and the spike high; this remains the level that would fully confirm a bullish trend change.
Support:
$0.018598 — first support, aligned with the pre-spike range's lower boundary.
$0.017064 — the deeper support and the origin of the current recovery; a break below this would undo the bullish structure built since August 8.
Trade Scenarios
Scenario A — Recovery continuation (aligned with the current push):
Entry: On a hold/bounce in the $0.018598–0.021 zone, or on continuation from current levels with confirmation
Stop-loss: Below $0.017064
Target 1: $0.023651
Target 2: $0.026840
Scenario B — Breakout entry:
Entry: On a confirmed break and close above $0.026840, ideally with RSI holding above 55–60
Stop-loss: Below $0.023651
Target: $0.028711 and potentially new highs beyond it
Scenario C — Deep retracement entry (conservative):
Entry: On a reaction/hold at $0.017064
Stop-loss: Below $0.017064, treating a break as full structure invalidation
Target 1: $0.018598
Target 2: $0.023651
The Risk Side of This Chart
The August 6 spike-and-crash is the defining event on this chart, and it's a clear signal that DODOX can move violently in both directions on thin liquidity — a roughly 30% rally followed by an equally fast reversal in the span of a single session. That kind of volatility tends to recur in coins with this profile, so position sizing should account for the possibility of sharp wicks in either direction, even during what looks like an orderly recovery.
Bottom Line
DODOX is showing real signs of a genuine recovery after its August 6 spike-and-crash, with RSI supporting the current push toward $0.023651. A hold above $0.018598–0.017064 keeps the recovery structure intact, but the more meaningful confirmation comes from a break above $0.026840, and ultimately $0.028711, given how sharply this asset has moved in both directions recently.
This article is for informational and educational purposes only and does not constitute financial advice. Cryptocurrency trading, and perpetual futures contracts in particular, involve substantial risk of loss — this is especially true for low-cap, highly volatile assets like the one discussed here. Always do your own research and manage risk according to your own financial situation before making any trading decisions.
@Binance Square Official #GoldChallenges$4380 #RobinhoodToOfferCryptoTradingInUK #TSMCJulyRevenueJumps45% #Binance #ChartSniper