
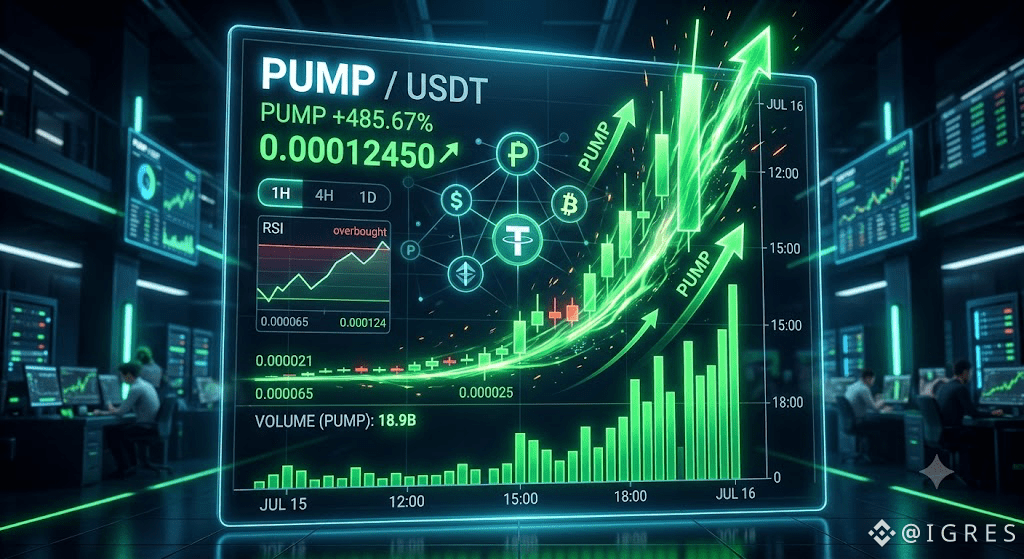
#PUMPUSDT💰 يوضح هذا الرسم البياني سيناريو "الضخ" (pump) استثنائي القوة لزوج PUMP/USDT، حيث حقق بالفعل مكسبًا سريعًا بنسبة 485%. ومع ذلك، تشير مؤشرات فنية رئيسية إلى أن الصعود قد يكون قريبًا من قمته. يقع مؤشر القوة النسبية (RSI) رسميًا في منطقة "تشبع شرائي" العميقة، وهي إشارة تقليدية تفيد بأن الأصل مُسعّر بأعلى من قيمته ويستعدّ لتصحيح أو تَماسك. وعلى الرغم من أن نمط الشموع المكافئ (parabolic) يُظهر زخمًا صعوديًا شديدًا، فإن هذا التركيب المكافئ غالبًا ما يكون غير مستدام لفترات طويلة. إذا استمر الاتجاه الصعودي اعتمادًا على الزخم الحالي فقط، فقد يدفع اكتشاف السعر إلى الأعلى، وربما يحاول اختبار مستويات نفسية مثل 0.0001500 أو حتى 0.0001800. ومع ذلك، بمجرد أن يصل متوسط السعر إلى هذه المنطقة المسعّرة بحرارة، يصبح حدوث تراجع حاد باتجاه متوسط "القيمة السوقية العادلة" المستدام—ومن المرجح أن يكون في مكان ما بين نقطة اختراق 0.0000650 ومستوى 0.0000950—أكثر احتمالًا بكثير من استمرار الصعود العمودي


نشر
إخلاء مسؤولية: يتضمن آراء جهات خارجية. لا تُعدّ نصيحة. يُمكن استخدام Binance AI دون أي ضمان. اطلع على الشروط والأحكام.