
BANANAS31/USDT Perpetual · 15-Minute Chart · Structure Break & Fair Value Gap Analysis
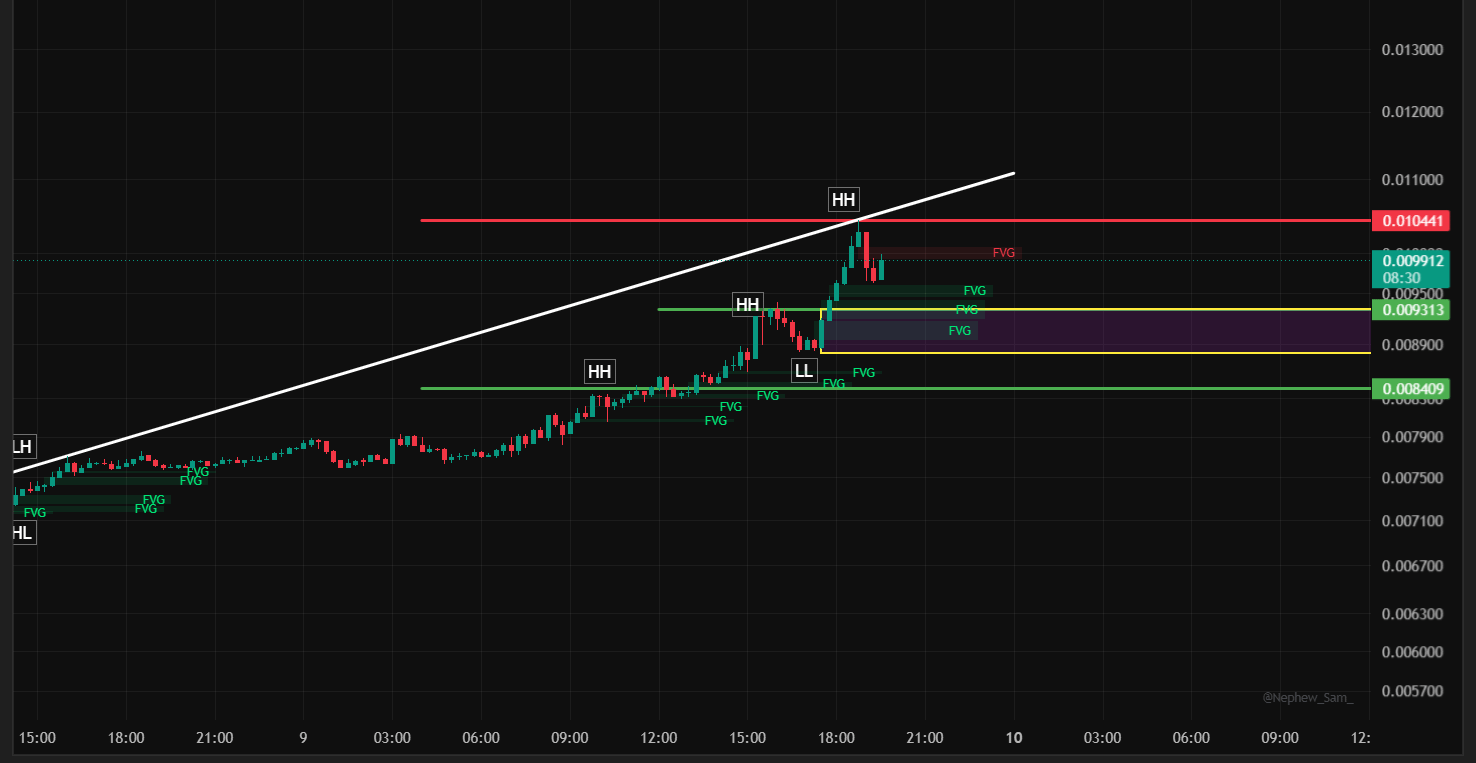
BANANAS31 has put together an impressive, sustained climb since its base near $0.0071, building a genuine staircase of Higher Highs that just culminated in a sharp spike to $0.010441 — the most aggressive single leg on the entire chart. Price has since pulled back to $0.009853, consolidating in a well-defined zone as it digests that move before the next decision point.
Reading the Structure
The trend has been remarkably consistent, with each leg building directly on the last:
A base around $0.0071–0.0079 established the first HH near $0.0081.
A steady climb carried price into a second HH near $0.0093.
A pullback into a Lower Low near $0.0089 was followed by the sharpest leg of the move — a vertical push straight into a fresh HH at $0.010441, tagging both the major resistance level and the rising trendline that's guided this entire rally.
That spike has since cooled into a consolidation range roughly between $0.0089 and $0.00931 (the highlighted zone on the chart), with price currently sitting at $0.009853. This kind of pullback after a sharp vertical leg is normal — the real question is whether it holds as a shallow consolidation or turns into a deeper retracement.
Key Levels to Watch
Resistance:
$0.010441 — the major resistance and the high of the recent spike; this is the level that needs to break and hold for the trend to extend further.
Above that, the rising trendline projects toward roughly $0.011, the next structural target if $0.010441 clears.
Support:
$0.009313 — first support, aligned with the lower edge of the current consolidation zone and the rising trendline.
$0.008409 — a deeper support shelf, marking the prior Lower Low and a key structural level.
$0.0071 — the origin Higher Low of the entire move; a break below this would undo the trend that's built since the start of this chart.
Trade Scenarios
Scenario A — Trendline pullback entry (aligned with the trend):
Entry: On a hold/bounce in the $0.009313–0.009853 zone
Stop-loss: Below $0.008409
Target 1: $0.010441
Target 2: Trendline extension toward $0.011
Scenario B — Breakout entry:
Entry: On a confirmed break and close above $0.010441
Stop-loss: Below $0.009313
Target: New highs, trailed as price discovers — no resistance is marked above $0.010441 on this chart
Scenario C — Deep retracement entry (conservative):
Entry: On a reaction/hold at $0.008409, or as deep as $0.0071 for full trendline confirmation
Stop-loss: Below $0.0071
Target 1: $0.009313
Target 2: $0.010441
The Risk Side of This Chart
The move from $0.0089 to $0.010441 happened almost entirely in a single vertical push — that kind of speed is a hallmark of thin, low-cap price action, and it tends to produce equally sharp pullbacks. The current consolidation is the first real test of whether buyers are willing to defend this level or whether the spike was a temporary overextension. Size positions with that volatility in mind.
Bottom Line
BANANAS31 has built a genuinely strong uptrend and just delivered its most aggressive leg yet, tagging $0.010441 before consolidating. A hold above $0.009313–0.008409 keeps the trend structurally intact, while a confirmed break above $0.010441 would be the clearest signal that the rally has room to extend toward the $0.011 trendline target.
This article is for informational and educational purposes only and does not constitute financial advice. Cryptocurrency trading, and perpetual futures contracts in particular, involve substantial risk of loss — this is especially true for low-cap, highly volatile assets like the one discussed here. Always do your own research and manage risk according to your own financial situation before making any trading decisions.
@Binance Square Official #SaylorHintsStrategyBitcoinBuy #BIP110SoftForkAttemptBegins #SouthKoreaProposesLooseningCryptoShareholderRules #Binance #ChartSniper