BICO IS TESTING THE AFTERMATH OF A SHARP REJECTION
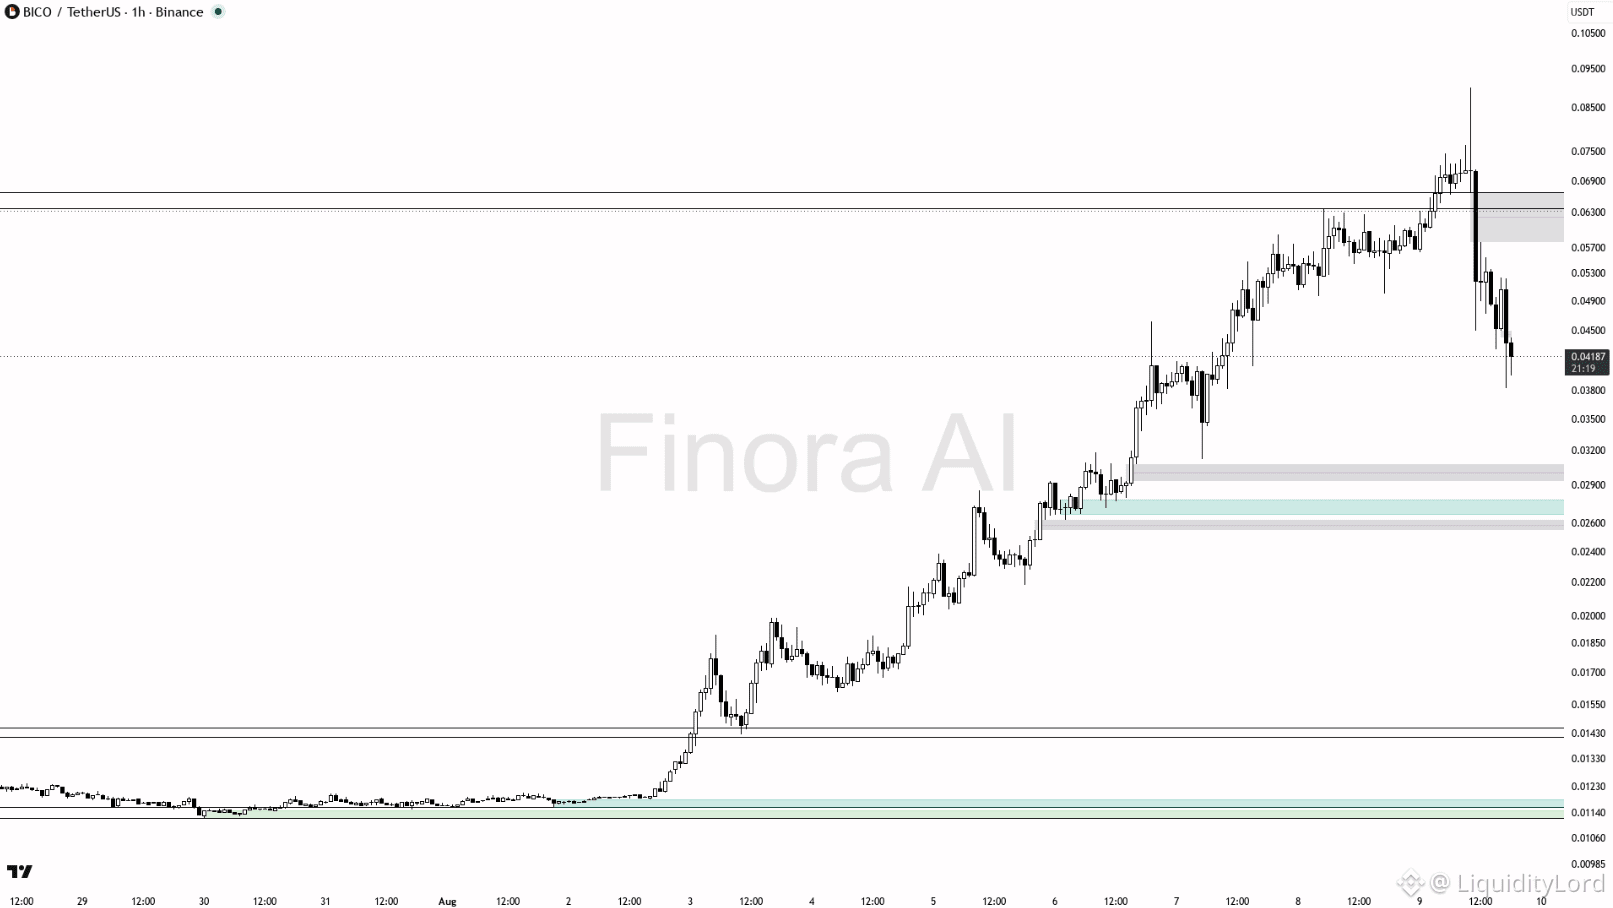
BICO pushed through a major resistance area near 0.063–0.065, accelerated toward 0.070+, and then printed a violent rejection. Price is now around 0.042, so the key question is whether this is a healthy retracement or the start of a deeper reset.
📊 MARKET STRUCTURE
The key area below is 0.026–0.030. This zone previously acted as a consolidation and demand area before.
🎯 TRADE MAP
- TP1: 0.0500
- TP2: 0.0580
- TP3: 0.0650
- Stop Loss: 0.0240
A close above 0.0500 would also show that buyers are willing to absorb the supply created by the rejection. Until that happens, I see the current move as a recovery attempt rather than a confirmed trend continuation.
Reclaiming 0.0580 would improve momentum, while a clean return above 0.0650 would signal that buyers have regained control of the failed breakout.
⚡ WHAT I AM WATCHING
I would not chase the first green candle after a move like this. The better confirmation would be a higher low followed by a reclaim of 0.0500. If price loses the 0.026–0.030 demand area, the bullish setup becomes much weaker.
The interesting part is that the chart still has a clear invalidation point. That makes the setup easier to manage: either buyers rebuild above demand, or the market proves that the previous impulse was exhausted.
🔷 LIQUIDITY ANGLE
STONfi becomes interesting here. Omniston aggregates liquidity across connected markets and lets competing resolvers search for better execution. This can reduce unnecessary price impact and slippage when liquidity is fragmented.
STONfi also keeps swaps self-custodial, so users maintain control of their assets while accessing broader liquidity. Execution now matters just as much as the chart setup.
NFA — DYOR 🚀
$BICO
BICO pushed through a major resistance area near 0.063–0.065, accelerated toward 0.070+, and then printed a violent rejection. Price is now around 0.042, so the key question is whether this is a healthy retracement or the start of a deeper reset.
📊 MARKET STRUCTURE
The key area below is 0.026–0.030. This zone previously acted as a consolidation and demand area before.
🎯 TRADE MAP
- TP1: 0.0500
- TP2: 0.0580
- TP3: 0.0650
- Stop Loss: 0.0240
A close above 0.0500 would also show that buyers are willing to absorb the supply created by the rejection. Until that happens, I see the current move as a recovery attempt rather than a confirmed trend continuation.
Reclaiming 0.0580 would improve momentum, while a clean return above 0.0650 would signal that buyers have regained control of the failed breakout.
⚡ WHAT I AM WATCHING
I would not chase the first green candle after a move like this. The better confirmation would be a higher low followed by a reclaim of 0.0500. If price loses the 0.026–0.030 demand area, the bullish setup becomes much weaker.
The interesting part is that the chart still has a clear invalidation point. That makes the setup easier to manage: either buyers rebuild above demand, or the market proves that the previous impulse was exhausted.
🔷 LIQUIDITY ANGLE
STONfi becomes interesting here. Omniston aggregates liquidity across connected markets and lets competing resolvers search for better execution. This can reduce unnecessary price impact and slippage when liquidity is fragmented.
STONfi also keeps swaps self-custodial, so users maintain control of their assets while accessing broader liquidity. Execution now matters just as much as the chart setup.
NFA — DYOR 🚀
$BICO