

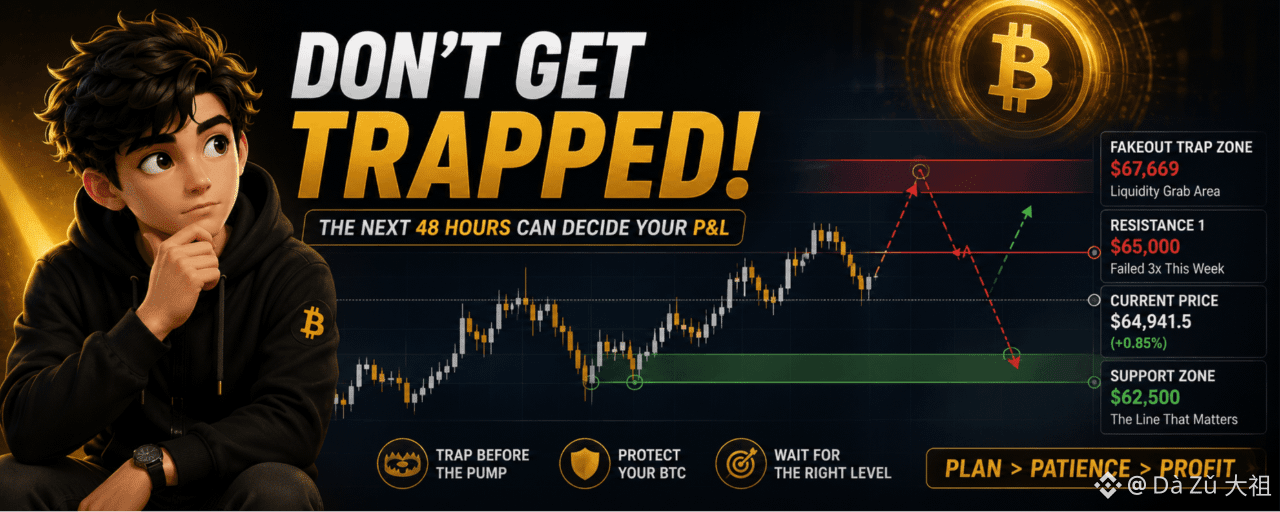

إذا كنت تمتلك بيتكوين، توقف عن التمرير لمدة 60 ثانية. هذا مخطط 4 ساعات سينقذك.
يعتقد الجميع أن البيتكوين (BTC) سيتجه مباشرةً إلى 70 ألف دولار من 64,941 دولارًا. يشير المخطط إلى أنهم على وشك أن ينفخوا ويُحاصروا.
إليك تحليلي العميق للأسبوع القادم:
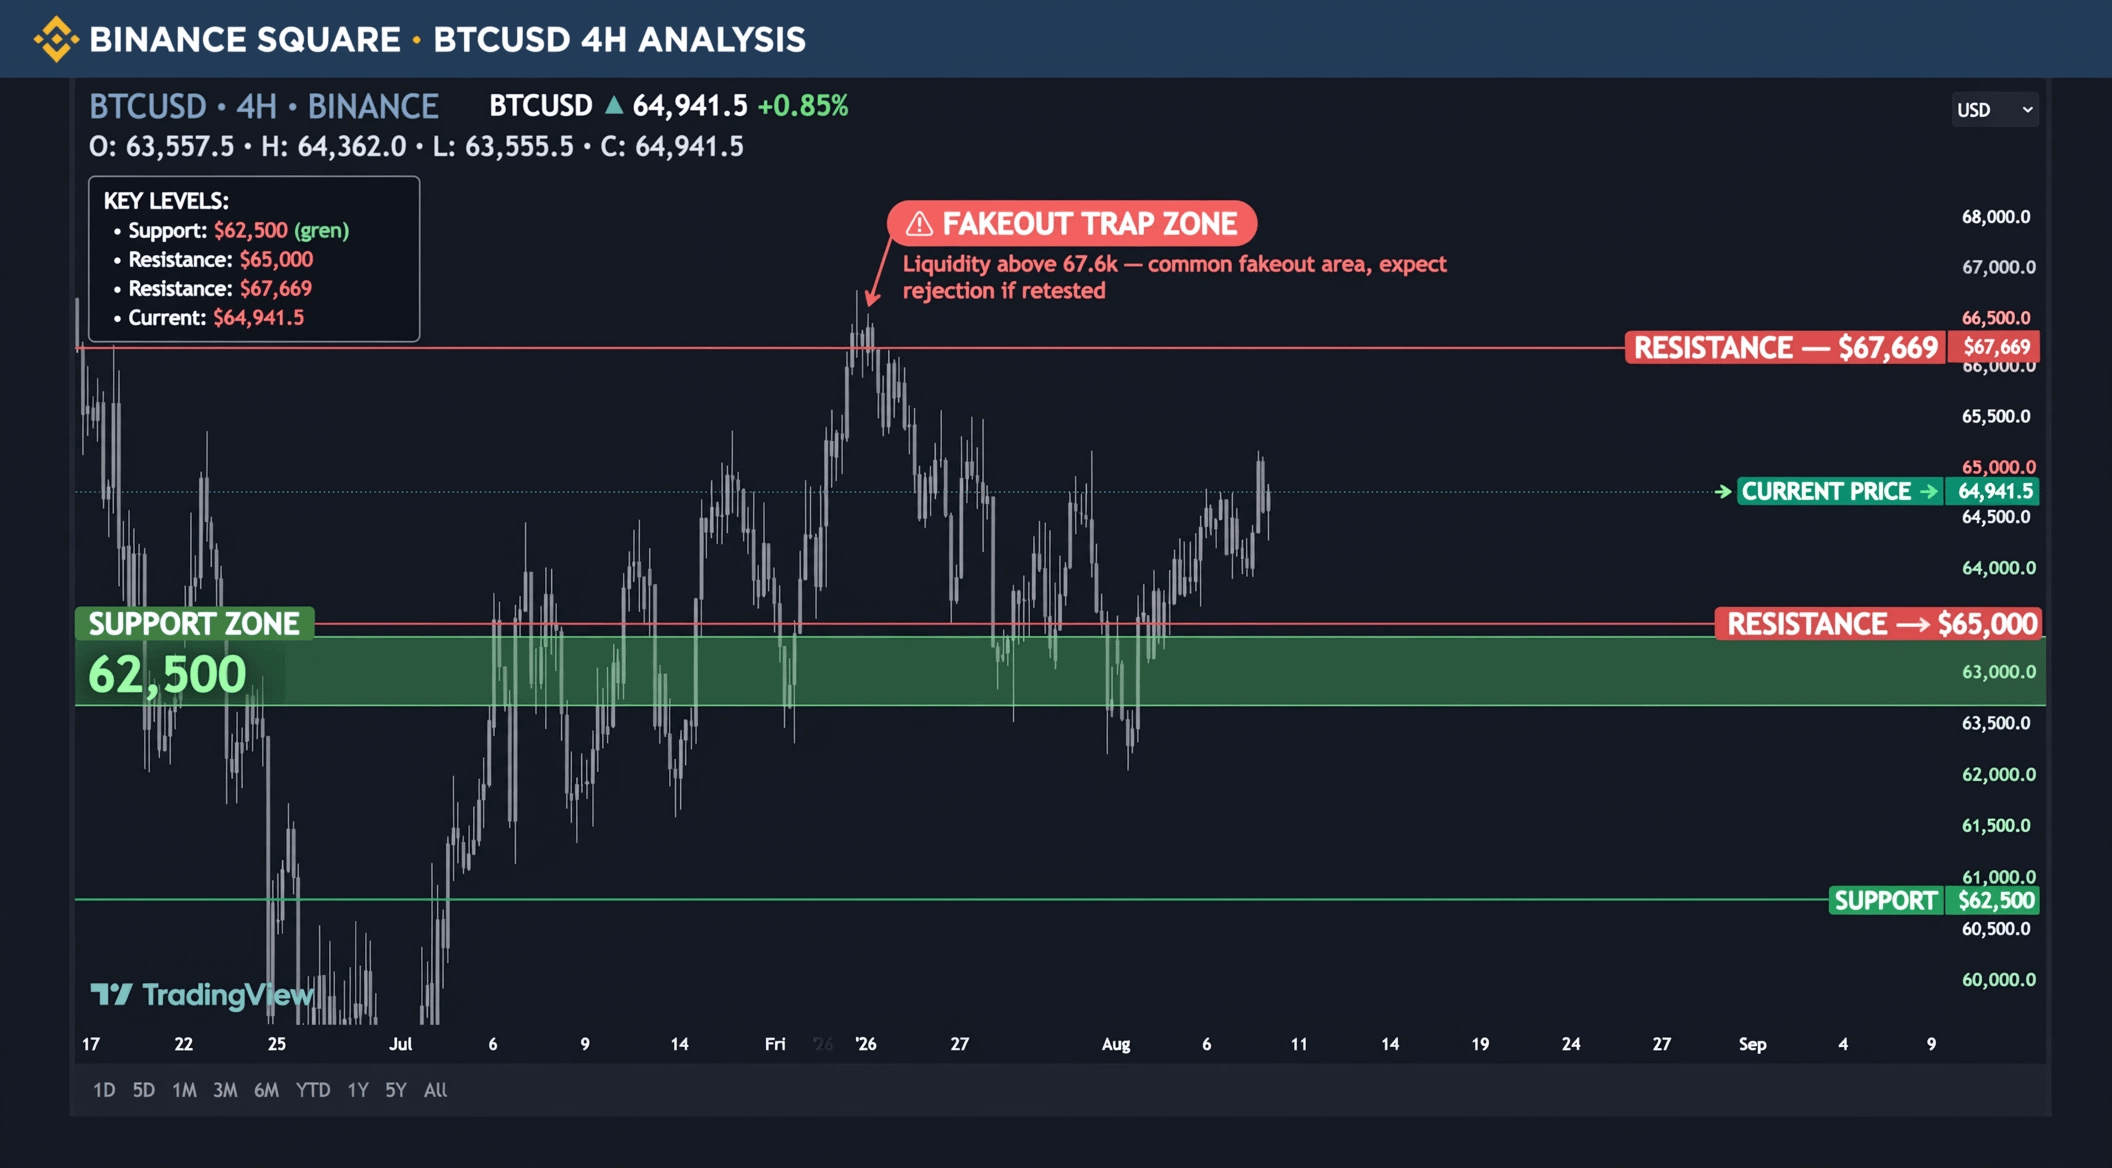
السعر الحالي: 64,941.5 دولار (+0.85%)
المستويات التي تهم:
المقاومة 1: 65,000 دولار - فشل هنا 3 مرات هذا الأسبوع. لا توجد أحجام تداول = لا يوجد اختراق.
منطقة فخ الاختراق الكاذب: 67,669 دولارًا - انظر إلى مخططِي. في المرة الأخيرة التي صعدنا فيها إلى 67,669، قمنا بالهبوط 5 آلاف دولار فورًا. هذه منطقة لاصطياد السيولة بهدف تصفية مراكز البيع على المكشوف (shorts).
منطقة الدعم: 62,500 دولار - هذه المنطقة الخضراء أنقذتنا مرتين في يوليو. إنها الخط الفاصل بين الصعود والهبوط.
تنبؤي للأسبوع القادم - هل سنصل إلى 70 ألف دولار؟
السيناريو الرئيسي (احتمال 50%) - الفخ: البيتكوين يكسر 65 ألف دولار، الجميع يفتح صفقات شراء (long)، ثم يصل إلى 67,669 دولار ويهبط بقوة إلى 62,500 دولار. لن يأتي 70 ألف دولار مباشرة. سيأتي 62.5 ألف دولار أولًا، وذلِك سيكون منطقة الشراء الحقيقية لِـ 70 ألف دولار.
السيناريو الصاعد (احتمال 30%): إذا أغلَق البيتكوين شمعة يومية ABOVE (فوق) 67,669 دولار بحجم تداول ضخم، فحينها يصبح 70 ألف دولار متاحًا الأسبوع القادم.
السيناريو الهابط (احتمال 20%): إذا انكسر 62,500 دولار، فسنصل مباشرة إلى 60,000 دولار.
إذن، هل سيصل سعر البيتكوين إلى 70 ألف دولار الأسبوع القادم؟ نعم، لكن ليس قبل فخّ المتداولين الصاعدين (bulls). أتوقع 62.5 ألف دولار قبل 70 ألف دولار.
تحرّكت الحيتان بمقدار 300 مليون دولار+ من البيتكوين إلى البورصات أمس. التمويل (Funding) آخذ في الارتفاع. لا تكن سيولة خروج (exit liquidity).
أنا لا أطارد هنا. أنا أنتظر عند 62.5 ألف دولار.
وماذا عنك؟ هل تعتقد أن البيتكوين يصل إلى 70 ألف دولار مباشرة أم 62.5 ألف دولار أولًا؟ اكتب BULL أو BEAR في التعليقات أدناه - وأرد على الجميع.
ليس نصيحة مالية. مجرد تحليلي.
#BIP110ForkSignalingExpectedThisWeekend #VIXFallsToJanuaryLow #IraqOilExportsFall75% #FedSplitOnRateHikesDeepens #USJulyJobsUnexpectedlyFall $TUT $MMT $VIC