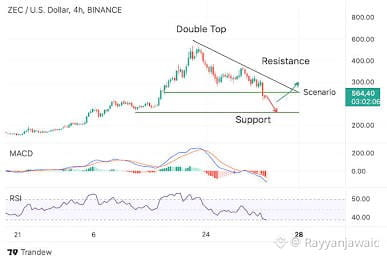
$ZEC Zcash ($ZEC ) يتداول حول $508–$517، مُظهِرًا بوادر مبكرة لاختراق صعودي بعد كسره بشكل واضح لنطاق ضغط المتوسطات المتحركة قصير الأجل.
CoinDCX

تحليل الرسم البياني الفني لـ ZEC. المصدر: Binance
المستويات الفنية الرئيسية
المنطقةسعر المستوىالدلالةالسعر الحالي~$510يتماسك بعد تجاوز المتوسطات المتحركة الأسية الرئيسيةالدعم الفوري$486 – $492تحولت منطقة الدعم (عنقود 20 EMA و 50 EMA)الدعم الرئيسي$416مستوى إبطال الاتجاه طويل الأمد (200 EMA)المقاومة الفورية$535 – $550هدف اختراق قصير الأجلالمقاومة الرئيسية$590هدف متوسط الأجل (قمة التأرجح منتصف يوليو)
تفصيل فني
اتجاه المؤشرات: مؤشر القوة النسبية (RSI) يقع قرب 56، مُشيرًا إلى سيطرة فعّالة من المشترين مع زخم صحي. يعكس MACD تقاطعًا صعوديًا بسيطًا.
CoinDCX
المتوسطات المتحركة: يتداول السعر فوق المتوسطات المتحركة الأسية لـ 20 و 50 و 100 و 200، ما يؤكد أن البنية العامة للاتجاه الصعودي لا تزال قائمة.
CoinDCX
الآفاق: طالما أن $ZEC يبقى فوق نطاق الدعم $486–$492، فالمسار يفتح أمام اختبار $535 ثم $590. أما الإغلاق اليومي أسفل $486 فسيُبطل الإعداد الصعودي الفوري.
CoinDCX+ 1
للتعمق في تحليل تداول ZEC:
اعرض مناطق الدعم والمقاومة الرئيسية على الأطر الزمنية الأقل
حلل معنويات سوق عملات الخصوصية واتجاهات الحجم
#USSolarStocksRisePremarket #SKHynixToInvest19.1TWonInM17Plant #TSEPlansReReviewForMajorBusinessChanges #DollarSetForBestDayInTwoWeeks
CoinDCX

تحليل الرسم البياني الفني لـ ZEC. المصدر: Binance
المستويات الفنية الرئيسية
المنطقةسعر المستوىالدلالةالسعر الحالي~$510يتماسك بعد تجاوز المتوسطات المتحركة الأسية الرئيسيةالدعم الفوري$486 – $492تحولت منطقة الدعم (عنقود 20 EMA و 50 EMA)الدعم الرئيسي$416مستوى إبطال الاتجاه طويل الأمد (200 EMA)المقاومة الفورية$535 – $550هدف اختراق قصير الأجلالمقاومة الرئيسية$590هدف متوسط الأجل (قمة التأرجح منتصف يوليو)
تفصيل فني
اتجاه المؤشرات: مؤشر القوة النسبية (RSI) يقع قرب 56، مُشيرًا إلى سيطرة فعّالة من المشترين مع زخم صحي. يعكس MACD تقاطعًا صعوديًا بسيطًا.
CoinDCX
المتوسطات المتحركة: يتداول السعر فوق المتوسطات المتحركة الأسية لـ 20 و 50 و 100 و 200، ما يؤكد أن البنية العامة للاتجاه الصعودي لا تزال قائمة.
CoinDCX
الآفاق: طالما أن $ZEC يبقى فوق نطاق الدعم $486–$492، فالمسار يفتح أمام اختبار $535 ثم $590. أما الإغلاق اليومي أسفل $486 فسيُبطل الإعداد الصعودي الفوري.
CoinDCX+ 1
للتعمق في تحليل تداول ZEC:
اعرض مناطق الدعم والمقاومة الرئيسية على الأطر الزمنية الأقل
حلل معنويات سوق عملات الخصوصية واتجاهات الحجم
#USSolarStocksRisePremarket #SKHynixToInvest19.1TWonInM17Plant #TSEPlansReReviewForMajorBusinessChanges #DollarSetForBestDayInTwoWeeks