The Bitcoin price ($BTC /USD), in November, found support at around the 0.786 Fibonacci Retracement level, ending a 45-day slump that began in early October. Bitcoin fell from its current all-time high of about $126,198 on October 6 to trade at about $80,391 on November 21, before bouncing back to the current level of $95,236.
The final quarter of 2025 saw the crypto market shed most of the gains it made in the previous two quarters amid a slowdown in digital asset treasuries (DATs) activity and a net-negative in the overall institutional buying activity.
Starting in the second half of 2025, Bitcoin enjoyed one of its biggest rallies in recent years, ascending from its April 2025 lows of about $75,000 to set the current all-time highs above $126,000 in October. Most of this rally was driven by rising institutional adoption, with more mainstream companies targeting DATs to diversify their balance sheets.
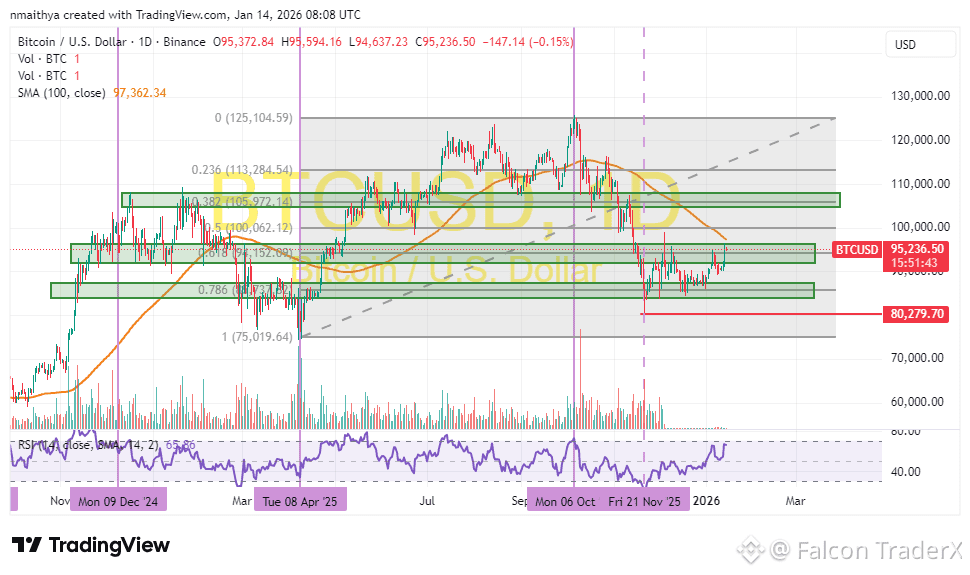
From a technical perspective, the Bitcoin price has bounced back to move closer to the 100-day moving average, which now acts as a potential resistance. Should the BTC/USD rise above it, it could signal a potential change in the market sentiment from bearish to bullish, paving the way for a potential run above $100,000.
The Relative Strength Index indicator also supports a bullish sentiment as the 14-day smoothed moving average moves closer to overbought conditions.
Should the 100-day MA trigger a pullback, the 0.786 Fib level at about $85,000 will continue to act as a strong support level, making it a perfect re-accumulation zone.
Bitcoin’s Rising Institutional Ownership and the Macro Effect
Another factor supporting Bitcoin’s long-term bull case is the rising institutional buying activity. As demonstrated in the chart below, institutional buying increased significantly over the last two years, first triggered by the launch of Spot Bitcoin ETFs at the start of 2024, and again by the rise of digital asset treasuries from April through November 2025.
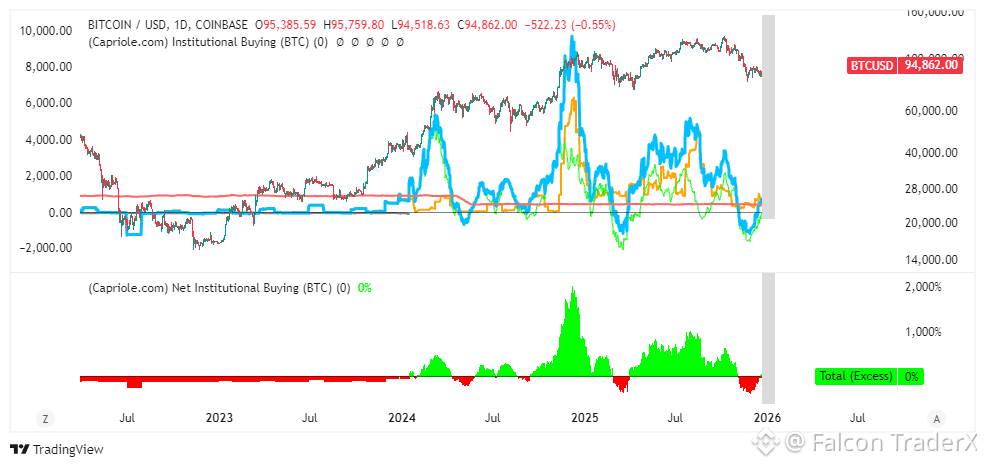
However, the figures have fallen in the past two months, amid adverse global economic conditions and the shift towards AI.
The Bitcoin price is increasingly being affected by macroeconomic conditions, with the October 6 plunge coinciding with Trump’s tariff threats against China. The most recent rebound to $95,000 also coincides with the U.S. airstrikes on Venezuela and the capture of the country’s President, amid the battle to control oil resources.
However, with a lot of technology investors now directing their investments to artificial intelligence, there is likely a short-term capital squeeze in the crypto sector, which means technical indicators will likely drive price patterns. This sets the Bitcoin price up for a potential choppy 2026, as it waits for AI saturation.And it will not be a simple task to accurately identify those buying sprees and their probable time frames.
This is where trading algorithms can be very important. A good investor-algorithm will be able to identify both the buying and selling opportunities and understand the probable time frame of that activity. We may well see more periods of little activity punctuated by heavy volume periods of activity.
But overall, Bitcoin’s long-term trend will still paint a bullish picture, likely characterised by notable valleys rather than a straightforward rally.
At Algoz, we identified this at the end of Q2 25 and began creating more responsive trading signals - we believe we are well-positioned for the new norm of Crypto trading.
#MarketRebound @Binance Square Official #BTC100kNext? #StrategyBTCPurchase #WriteToEarnUpgrade $BNB $ETH


