
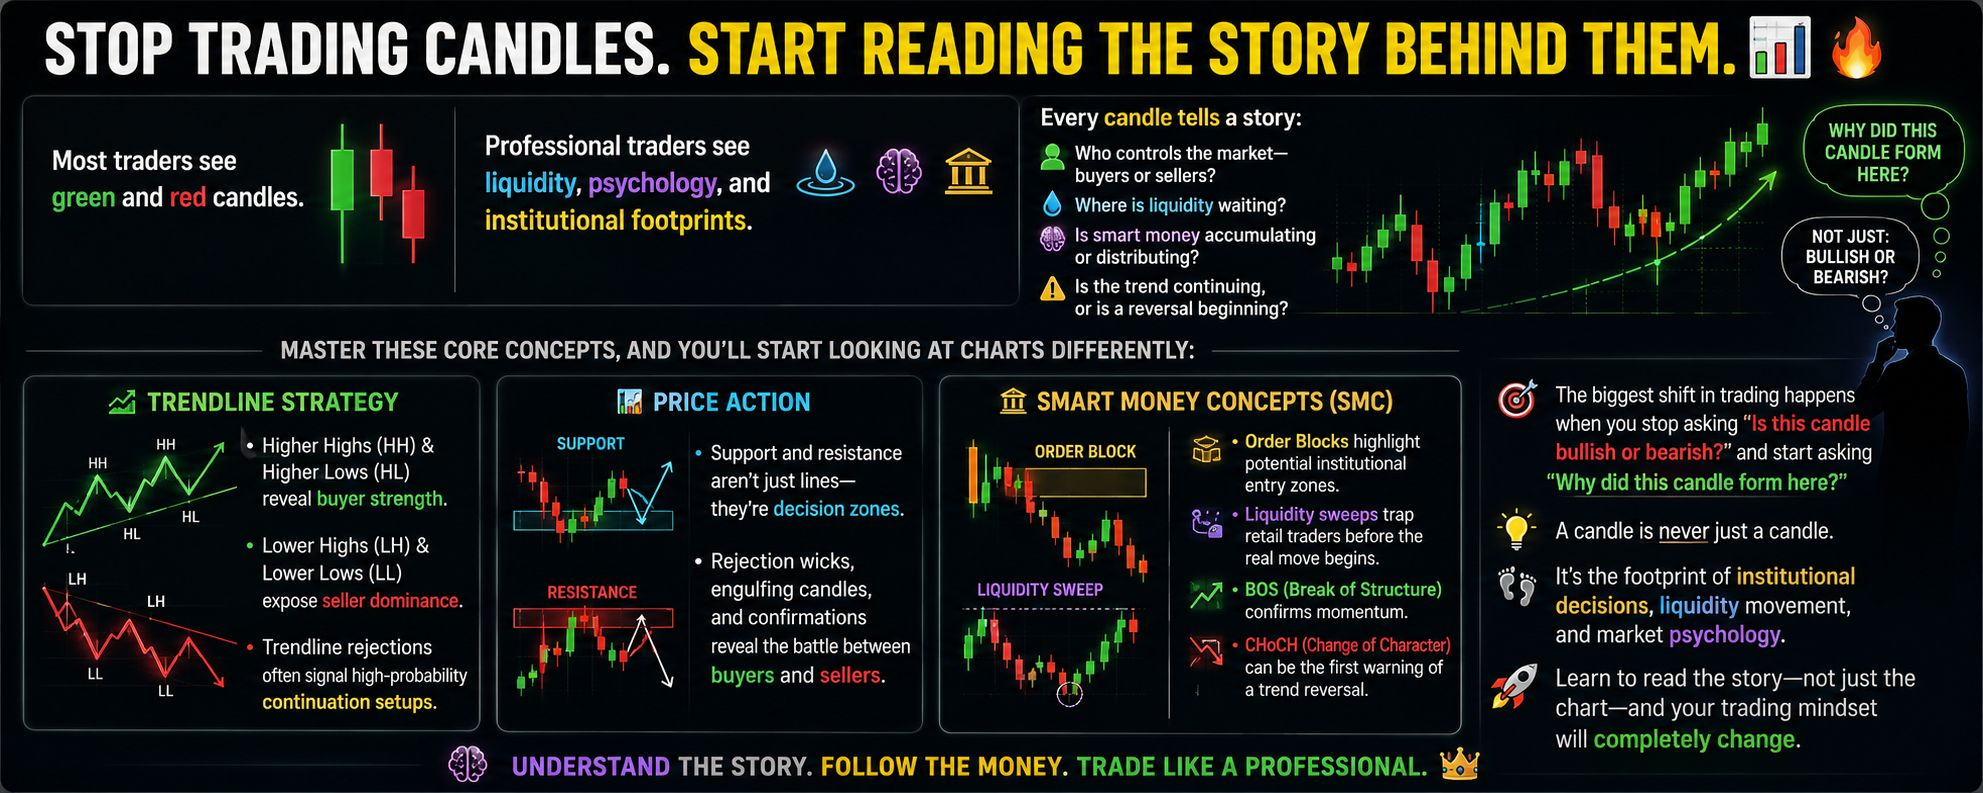

معظم المتداولين يرون شموعًا خضراء وحمراء.
يرى المتداولون المحترفون السيولة وعلم النفس وآثار المؤسسات. 💡
كل شمعة تروي قصة:
🔹 من يتحكم في السوق—الشارون أم البائعون؟
🔹 أين توجد السيولة منتظرة؟
🔹 هل الأموال الذكية تتراكم أم توزّع؟
🔹 هل الاتجاه مستمر، أم أن الانعكاس قد بدأ؟
أتقن هذه المفاهيم الأساسية، وستبدأ في النظر إلى الرسوم البيانية بشكل مختلف:
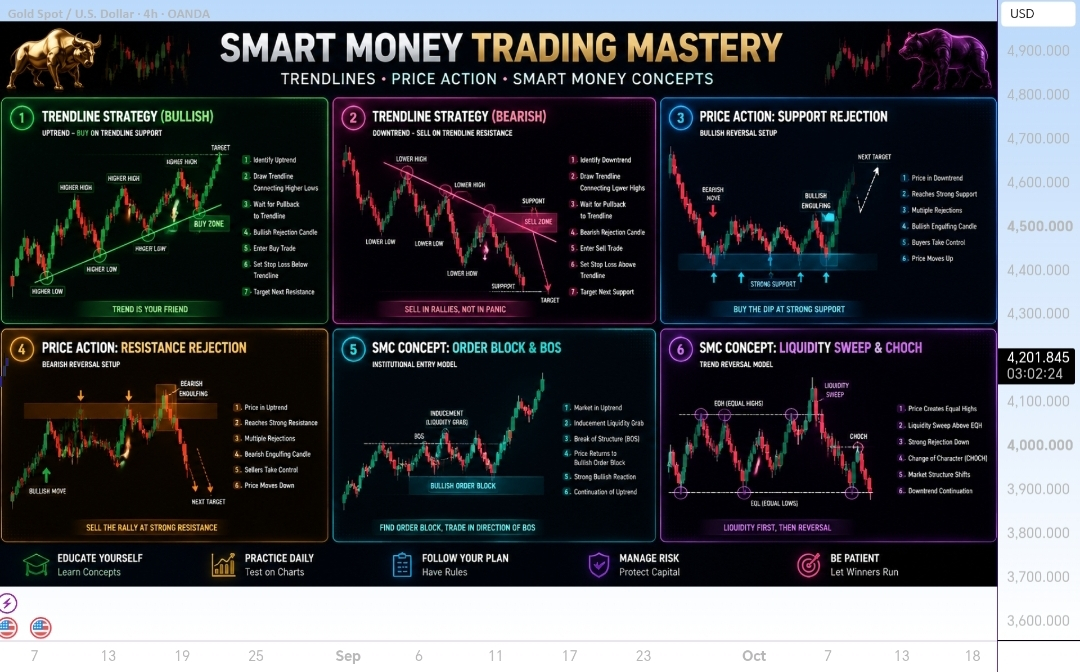
📈 استراتيجية خط الاتجاه
• قمم أعلى (HH) وقيعان أعلى (HL) تكشف عن قوة الشراء.
• قمم أدنى (LH) وقيعان أدنى (LL) تكشف عن هيمنة البائعين.
• رفض خطوط الاتجاه غالبًا ما يشير إلى سيناريوهات استمرار عالية الاحتمال.
📊 حركة السعر (Price Action)
• الدعم والمقاومة ليست مجرد خطوط—بل هي مناطق اتخاذ قرار.
• ذيول الرفض (Rejection wicks)، والشموع الابتلاعية (engulfing candles)، والتأكيدات تكشف المعركة بين المشترين والبائعين.
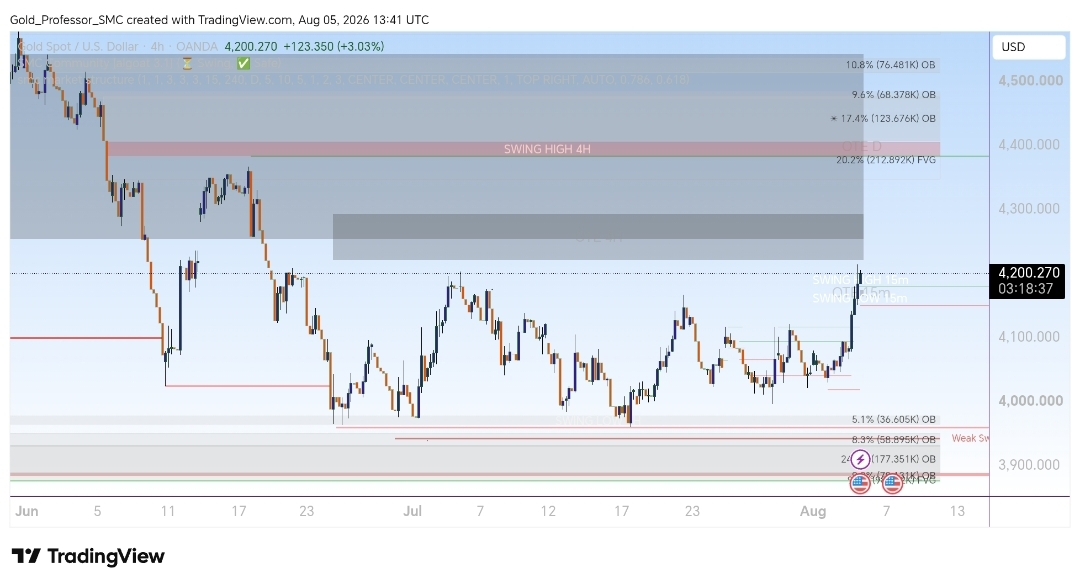
🏦 المفاهيم الذكية للسيولة (SMC)
• مناطق كتل الأوامر (Order Blocks) تُبرز مناطق دخول محتملة للمؤسسات.
• عمليات مسح السيولة (Liquidity sweeps) تُوقع متداولي التجزئة قبل أن يبدأ التحرك الحقيقي.
• BOS (اختراق البنية - Break of Structure) يؤكد الزخم.
• CHoCH (تغير نمط الشخصية - Change of Character) قد يكون أول تحذير من احتمال انعكاس اتجاه.
أكبر تحول في التداول يحدث عندما تتوقف عن سؤال "هل هذه الشمعة صعودية أم هبوطية؟" وتبدأ بسؤال "لماذا تشكلت هذه الشمعة هنا؟"
الشمعة ليست مجرد شمعة.
إنها بصمة قرارات المؤسسات، وحركة السيولة، وعلم نفس السوق. تعلّم قراءة القصة—وليس الرسم البياني فقط—وسيُغيّر ذلك تمامًا طريقة تفكيرك في التداول. 🚀
💬 أي مفهوم حسّن تداولك أكثر: حركة السعر (Price Action)، خطوط الاتجاه (Trendlines)، أم المفاهيم الذكية للسيولة (Smart Money Concepts - SMC)؟ شارك إجابتك أدناه!
إذا وجدت هذا المؤشر مفيدًا، اضغط زر الإعجاب ❤️ واتبع 🚀 للحصول على رؤى يومية مميزة في عالم العملات الرقمية!


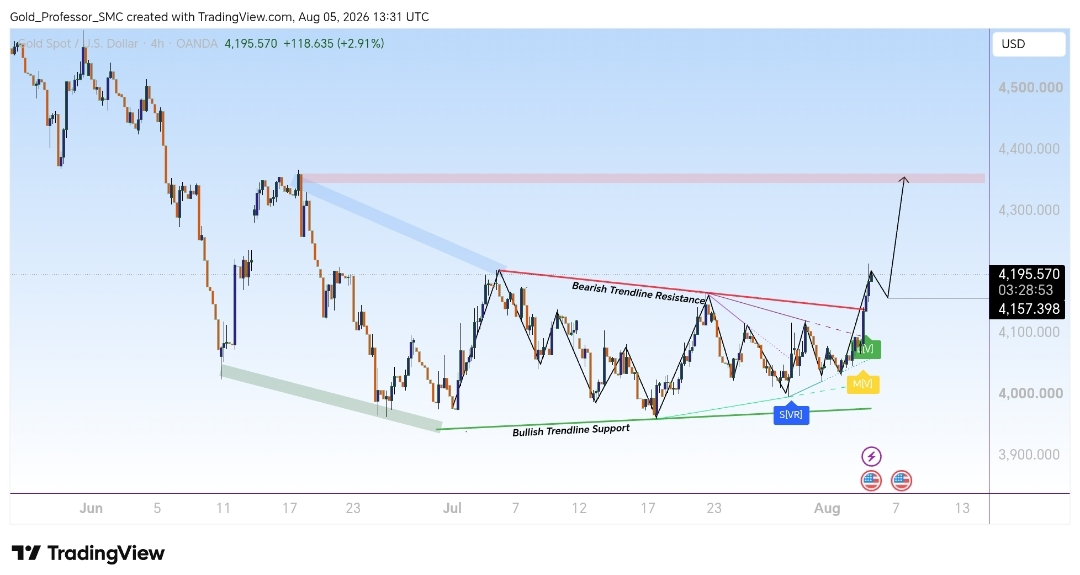
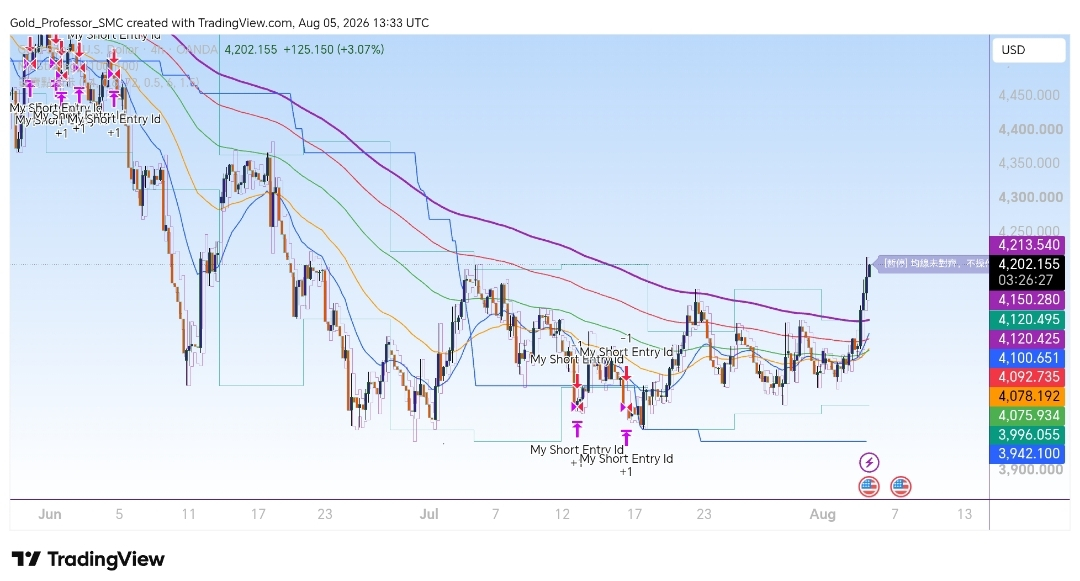
#GOLD #XAU #xaut #educational_post $HFT $ACE #GoldBreaksOutFromJanuaryDowntrend