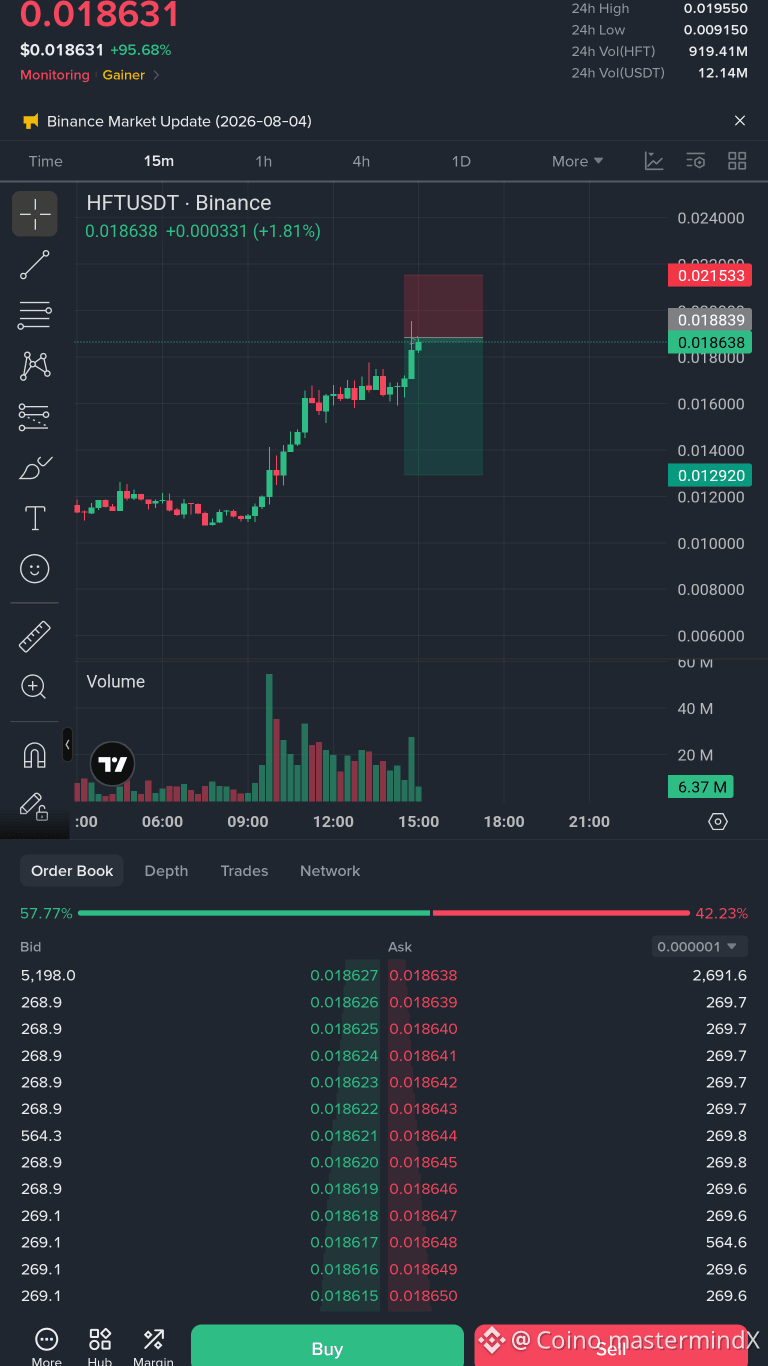
استنادًا فقط إلى مخطط بينانس لمدة 15 دقيقة هذا $HFT
(دون النظر إلى الأطر الزمنية الأعلى)، إليك التحليل:
الاتجاه العام: صاعد
سعر حقق اختراقًا قويًا من حوالي 0.011–0.012 إلى 0.0186.
قمم أعلى وقيعان أعلى تشير إلى أن المشترين هم المسيطرون.
زاد حجم التداول أثناء الاندفاع، ما يؤكد وجود اهتمام بالشراء.
المستويات الرئيسية
المقاومة: 0.0195–0.0215
هذه هي المنطقة الرئيسية التالية التي قد يظهر فيها البائعون.
مخططك يُظهر أيضًا منطقة جني أرباح قرب 0.0215.
الدعم:
0.0178–0.0180 (الدعم الأول)
0.0160 (دعم قوي)
0.0130 (دعم رئيسي إذا ضعف الاتجاه)
العائد/المخاطرة
سيناريو صاعد: إذا ثبت السعر فوق 0.0180 وكسر 0.0195، فقد يختبر 0.0215.
سيناريو هابط: إذا خسر السعر 0.0180 مع حجم بيع قوي، فقد يعيد التراجع باتجاه 0.0160.
التحيز الحالي: صاعد، لكن متضخم/مبالغ فيه. ملاحقة السعر بعد مكسب يومي يقارب 96% تحمل مخاطر. الانتظار إما لتصحيح باتجاه الدعم أو لاختراق مؤكد فوق المقاومة يُعد نهجًا أكثر انضباطًا.
#HFT #TrenddingTopic #CryptoNewss #crypto
(دون النظر إلى الأطر الزمنية الأعلى)، إليك التحليل:
الاتجاه العام: صاعد
سعر حقق اختراقًا قويًا من حوالي 0.011–0.012 إلى 0.0186.
قمم أعلى وقيعان أعلى تشير إلى أن المشترين هم المسيطرون.
زاد حجم التداول أثناء الاندفاع، ما يؤكد وجود اهتمام بالشراء.
المستويات الرئيسية
المقاومة: 0.0195–0.0215
هذه هي المنطقة الرئيسية التالية التي قد يظهر فيها البائعون.
مخططك يُظهر أيضًا منطقة جني أرباح قرب 0.0215.
الدعم:
0.0178–0.0180 (الدعم الأول)
0.0160 (دعم قوي)
0.0130 (دعم رئيسي إذا ضعف الاتجاه)
العائد/المخاطرة
سيناريو صاعد: إذا ثبت السعر فوق 0.0180 وكسر 0.0195، فقد يختبر 0.0215.
سيناريو هابط: إذا خسر السعر 0.0180 مع حجم بيع قوي، فقد يعيد التراجع باتجاه 0.0160.
التحيز الحالي: صاعد، لكن متضخم/مبالغ فيه. ملاحقة السعر بعد مكسب يومي يقارب 96% تحمل مخاطر. الانتظار إما لتصحيح باتجاه الدعم أو لاختراق مؤكد فوق المقاومة يُعد نهجًا أكثر انضباطًا.
#HFT #TrenddingTopic #CryptoNewss #crypto