الرسوم البيانية التي لا يريدها ثيران بيتكوين 📉
على مدى سنوات، تفوقت بيتكوين ($BTC ) باستمرار على الأسهم، ما عزز سمعتها كأحد أفضل الأصول أداءً.
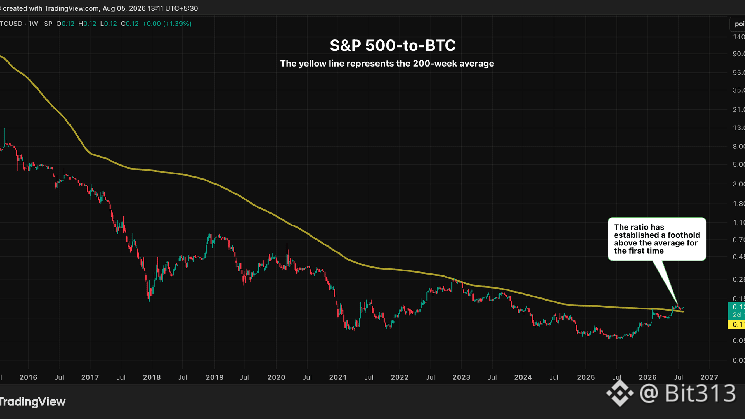
الآن، تستحوذ على الانتباه رسوم بيانية طويلة الأجل واحدة: نسبة S&P 500 إلى بيتكوين، والتي تقيس مقدار بيتكوين (BTC) اللازم لشراء مؤشر S&P 500.
• في 2012، كان يلزم أكثر من 300 BTC لشراء المؤشر.
• اليوم، لا يلزم سوى حوالي 0.12 BTC.
منذ السنوات الأولى لبيتكوين، اتجهت هذه النسبة في أغلب الأحيان نحو الانخفاض، بما يعكس التفوق الهائل لـ $BTC . ومع ذلك، تشير تحركات الأسعار الأخيرة إلى أن هذا الاتجاه قد يكون في طريقه إلى التباطؤ، ما يثير تساؤلات حول ما إذا كانت الأسهم بدأت في استعادة قوتها النسبية.
هل هذا مجرد تحول مؤقت، أم بداية اتجاه طويل الأجل جديد؟#USTelecomStocksFallPreMarket #GlobalStocksHitRecordHigh #SCCrudeDrops6.01%
على مدى سنوات، تفوقت بيتكوين ($BTC ) باستمرار على الأسهم، ما عزز سمعتها كأحد أفضل الأصول أداءً.
الآن، تستحوذ على الانتباه رسوم بيانية طويلة الأجل واحدة: نسبة S&P 500 إلى بيتكوين، والتي تقيس مقدار بيتكوين (BTC) اللازم لشراء مؤشر S&P 500.
• في 2012، كان يلزم أكثر من 300 BTC لشراء المؤشر.
• اليوم، لا يلزم سوى حوالي 0.12 BTC.
منذ السنوات الأولى لبيتكوين، اتجهت هذه النسبة في أغلب الأحيان نحو الانخفاض، بما يعكس التفوق الهائل لـ $BTC . ومع ذلك، تشير تحركات الأسعار الأخيرة إلى أن هذا الاتجاه قد يكون في طريقه إلى التباطؤ، ما يثير تساؤلات حول ما إذا كانت الأسهم بدأت في استعادة قوتها النسبية.
هل هذا مجرد تحول مؤقت، أم بداية اتجاه طويل الأجل جديد؟#USTelecomStocksFallPreMarket #GlobalStocksHitRecordHigh #SCCrudeDrops6.01%