🔥 $TRX / USDT: ارتفاع مفاجئ في تذبذب 1 ساعة & إعادة اختبار دعم ديناميكي
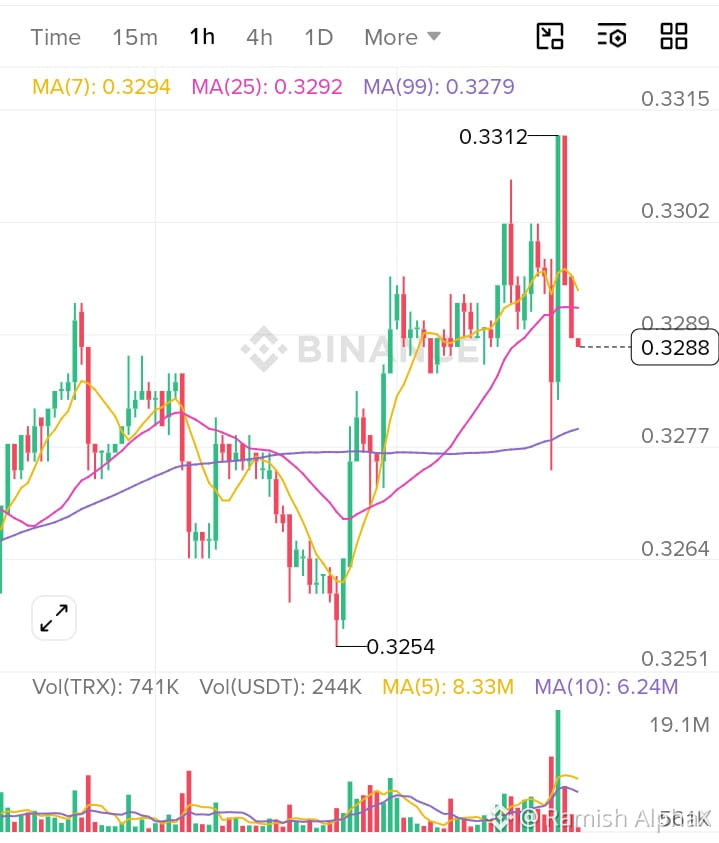
يعرض مخطط الساعة الواحدة (1H) لـ $TRX /USDT مسح سيولة سريعًا وصولاً إلى 0.3312$، تلاه مباشرةً هبوط حاد إلى دعم ديناميكي. السعر يستقر حاليًا حول 0.3288$، ويقف فوق مباشرةً خطوط المتوسطات المتحركة الرئيسية.
📊 اتجاه السوق: محايد / إعادة اختبار صعودي
تحليل الاتجاه: أكملت TRX حركة مسح واسعة من أدنى مستوى محلي عند 0.3254$ وصولاً إلى 0.3312$ قبل أن تواجه جني أرباح قوي. وعلى الرغم من شمعة الهبوط الحاد، ما زال السعر محافظًا على مستوى أعلى من خط الأساس لساعة واحدة MA(99) (0.3279$) ويختبر منطقة التقاء 1H MA(7) (0.3294$) و MA(25) (0.3292$).
🎯 إعداد الصفقة: شراء طويل (LONG) (عند إعادة الاختبار / التأكيد)
الإجراء: قم بـ LONG على تثبيت مضبوط داخل بلوك الأوامر الديناميكي.
منطقة الدخول: 0.3275 – 0.3290 (تقاطُع مع طلب ديناميكي 1H MA(99) و MA(25))
وقف الخسارة (SL): 0.3245 (أسفل آخر تأرجح بنيوي رئيسي عند 0.3254$)
جني الربح 1 (TP1): 0.3312 (مسح فوري لأعلى مستوى محلي BSL)
جني الربح 2 (TP2): 0.3350 (هدف مقاومة على المدى المتوسط)
جني الربح 3 (TP3): 0.3420 (هدف توسع الاتجاه على المدى الأكبر)
المخاطرة:العائد (R:R): ~1:2.4 (حتى TP2)
إبطال الصفقة: إغلاق شمعة 1H مستمر تحت 0.3245$ يُبطل البنية الصعودية الفورية.
#TRX #Trxusdt #TRX/USDT❤️ #TRXUSD #TRXUpdate
يعرض مخطط الساعة الواحدة (1H) لـ $TRX /USDT مسح سيولة سريعًا وصولاً إلى 0.3312$، تلاه مباشرةً هبوط حاد إلى دعم ديناميكي. السعر يستقر حاليًا حول 0.3288$، ويقف فوق مباشرةً خطوط المتوسطات المتحركة الرئيسية.
📊 اتجاه السوق: محايد / إعادة اختبار صعودي
تحليل الاتجاه: أكملت TRX حركة مسح واسعة من أدنى مستوى محلي عند 0.3254$ وصولاً إلى 0.3312$ قبل أن تواجه جني أرباح قوي. وعلى الرغم من شمعة الهبوط الحاد، ما زال السعر محافظًا على مستوى أعلى من خط الأساس لساعة واحدة MA(99) (0.3279$) ويختبر منطقة التقاء 1H MA(7) (0.3294$) و MA(25) (0.3292$).
🎯 إعداد الصفقة: شراء طويل (LONG) (عند إعادة الاختبار / التأكيد)
الإجراء: قم بـ LONG على تثبيت مضبوط داخل بلوك الأوامر الديناميكي.
منطقة الدخول: 0.3275 – 0.3290 (تقاطُع مع طلب ديناميكي 1H MA(99) و MA(25))
وقف الخسارة (SL): 0.3245 (أسفل آخر تأرجح بنيوي رئيسي عند 0.3254$)
جني الربح 1 (TP1): 0.3312 (مسح فوري لأعلى مستوى محلي BSL)
جني الربح 2 (TP2): 0.3350 (هدف مقاومة على المدى المتوسط)
جني الربح 3 (TP3): 0.3420 (هدف توسع الاتجاه على المدى الأكبر)
المخاطرة:العائد (R:R): ~1:2.4 (حتى TP2)
إبطال الصفقة: إغلاق شمعة 1H مستمر تحت 0.3245$ يُبطل البنية الصعودية الفورية.
#TRX #Trxusdt #TRX/USDT❤️ #TRXUSD #TRXUpdate