$BTC
⚠️ بيتكوين عند مفترق حاسم: شموع حمراء وسياسات المتوسطات المتحركة تنزلق 📉
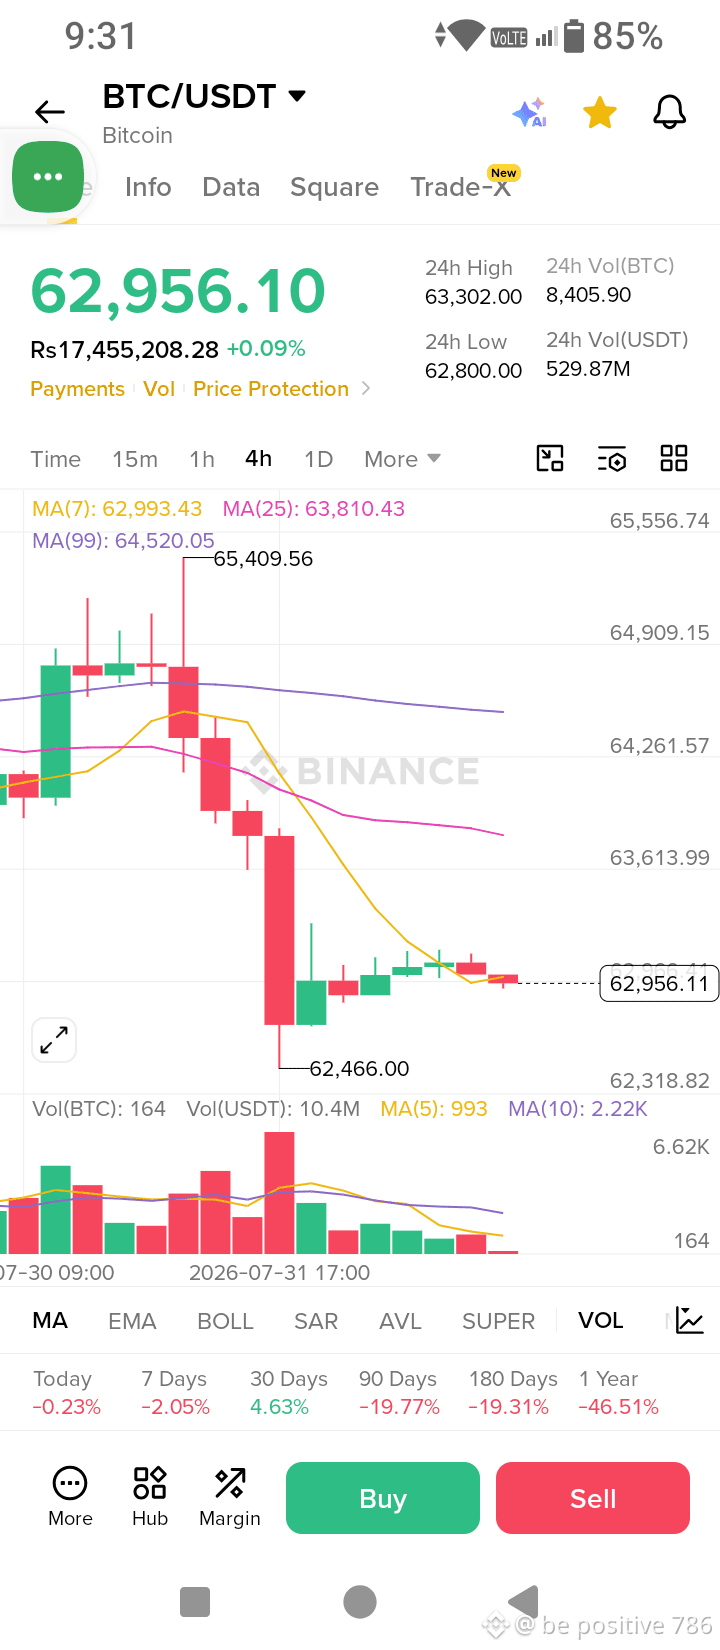
$BTC يتداول حاليًا حول 62,956 دولارًا، بالكاد يتمسك فوق أدنى مستوى تأرجح محلي حديث عند 62,466 دولارًا.
إذا ألقيت نظرة فاحصة وإمعانًا على مخطط الأربع ساعات، فالإعداد الفني يبرز عدة إشارات تحذيرية يجب على كل متداول الانتباه إليها قبل فتح صفقات بشكل أعمى.
🚨 ملاحظات فنية
رفض عند القمم: بعد الوصول إلى 65,409 دولارًا، شهدت بيتكوين هبوطًا حادًا ممثلًا بشموع حجم حمراء قوية، ما يشير إلى توزيع قوي من قبل البائعين.
محاذاة هابطة للمتوسطات المتحركة:
متوسط 7 (الأصفر) يمتلك زخمًا هابطًا قويًا ويتجه لأسفل تحت متوسط 25 (الوردي).
يتداول السعر تحت متوسط 99 على المدى الطويل (الأرجواني) عند 64,520 دولارًا بشكل واضح، ما يؤكد أن السيطرة على المدى القصير تعود للدببة.
محاولة ارتداد ضعيفة: التجميع الحالي قرب 62,900 دولار يفتقر إلى حجم شراء قوي (كما يظهر من تناقص أعمدة الحجم). وهذا يشير إلى غياب مشترين أقوياء، ويرفع من خطر حدوث اختراق هبوطي.
📉 مستويات رئيسية يجب مراقبتها
دعم فوري: 62,466 دولارًا (أدنى مستوى حديث). قد يؤدي الانهيار تحت هذا المستوى إلى تفعيل أوامر وقف الخسارة ودفع بيتكوين نحو مناطق دعم أدنى.
مقاومة فورية: 63,810 دولارًا (25 MA) و 64,520 دولارًا (99 MA). يجب أن تستعيد بيتكوين هذه المستويات بحجم قوي لإبطال البنية الهابطة.
🛡️ الاستراتيجية وإدارة المخاطر
رؤية التداول: الارتدادات الضعيفة مع انخفاض الحجم غالبًا ما تسبق موجة هبوط أخرى. تجنب الشراء بشكل أعمى لمجرد أن السعر منخفض. انتظر التأكيد—إما بنية قاع أعلى واضحة مع حجم قوي، أو استعادة متوسط 25.
احرص دائمًا على حماية رأس مالك واستخدم أوامر وقف خسارة صارمة!
ما خطتك؟ هل تلتقط الهبوط أم تنتظر على الهامش؟ لنتناقش أدناه! 👇
#BTC #CryptoTrading #BinanceSquare #TechnicalAnalysis #Bitcoin
⚠️ بيتكوين عند مفترق حاسم: شموع حمراء وسياسات المتوسطات المتحركة تنزلق 📉
$BTC يتداول حاليًا حول 62,956 دولارًا، بالكاد يتمسك فوق أدنى مستوى تأرجح محلي حديث عند 62,466 دولارًا.
إذا ألقيت نظرة فاحصة وإمعانًا على مخطط الأربع ساعات، فالإعداد الفني يبرز عدة إشارات تحذيرية يجب على كل متداول الانتباه إليها قبل فتح صفقات بشكل أعمى.
🚨 ملاحظات فنية
رفض عند القمم: بعد الوصول إلى 65,409 دولارًا، شهدت بيتكوين هبوطًا حادًا ممثلًا بشموع حجم حمراء قوية، ما يشير إلى توزيع قوي من قبل البائعين.
محاذاة هابطة للمتوسطات المتحركة:
متوسط 7 (الأصفر) يمتلك زخمًا هابطًا قويًا ويتجه لأسفل تحت متوسط 25 (الوردي).
يتداول السعر تحت متوسط 99 على المدى الطويل (الأرجواني) عند 64,520 دولارًا بشكل واضح، ما يؤكد أن السيطرة على المدى القصير تعود للدببة.
محاولة ارتداد ضعيفة: التجميع الحالي قرب 62,900 دولار يفتقر إلى حجم شراء قوي (كما يظهر من تناقص أعمدة الحجم). وهذا يشير إلى غياب مشترين أقوياء، ويرفع من خطر حدوث اختراق هبوطي.
📉 مستويات رئيسية يجب مراقبتها
دعم فوري: 62,466 دولارًا (أدنى مستوى حديث). قد يؤدي الانهيار تحت هذا المستوى إلى تفعيل أوامر وقف الخسارة ودفع بيتكوين نحو مناطق دعم أدنى.
مقاومة فورية: 63,810 دولارًا (25 MA) و 64,520 دولارًا (99 MA). يجب أن تستعيد بيتكوين هذه المستويات بحجم قوي لإبطال البنية الهابطة.
🛡️ الاستراتيجية وإدارة المخاطر
رؤية التداول: الارتدادات الضعيفة مع انخفاض الحجم غالبًا ما تسبق موجة هبوط أخرى. تجنب الشراء بشكل أعمى لمجرد أن السعر منخفض. انتظر التأكيد—إما بنية قاع أعلى واضحة مع حجم قوي، أو استعادة متوسط 25.
احرص دائمًا على حماية رأس مالك واستخدم أوامر وقف خسارة صارمة!
ما خطتك؟ هل تلتقط الهبوط أم تنتظر على الهامش؟ لنتناقش أدناه! 👇
#BTC #CryptoTrading #BinanceSquare #TechnicalAnalysis #Bitcoin