$BTC يمسك الدعم الرئيسي – هل بدأت ارتدة صعودية؟ 📈
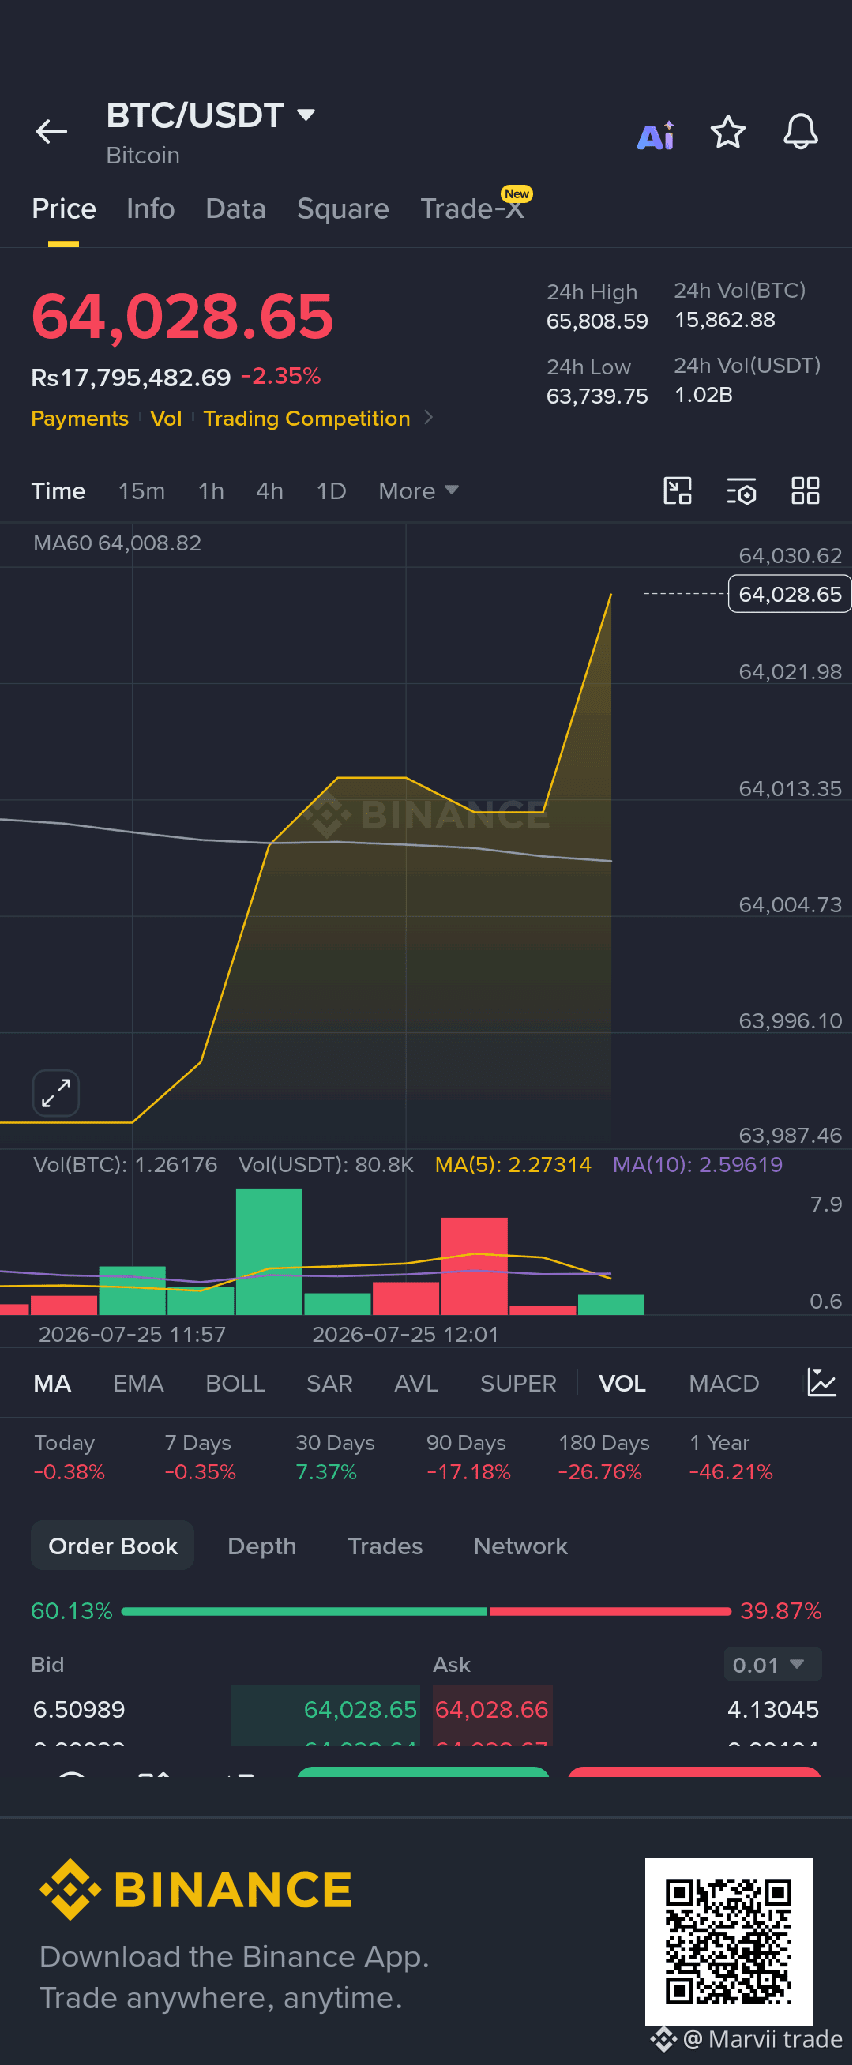
يشير البيتكوين إلى علامات تعافٍ بعد العثور على دعم قرب منطقة 63,700$–64,000$. كما يظهر في الرسم البياني، تدخل المشترون ودفَعوا السعر مجددًا فوق المتوسط المتحرك قصير الأجل، ما يوحي بأن الزخم الصعودي قد يعود.
قد يشجع استمرار الحركة فوق 64,000$ المشترين على استهداف منطقة المقاومة 64,800$–65,800$. إذا واصل حجم التداول الزيادة، فسيعزز ذلك فرص استمرار الاتجاه الصاعد.
ومع ذلك، يجب على المتداولين توخي الحذر. إذا فشل BTC في الحفاظ على مستوى 64,000$، فقد يعود ضغط البيع ويدفع السعر للعودة نحو منطقة الدعم الأخيرة. مراقبة حجم التداول وحركة السعر حول هذه المستويات أمر ضروري قبل اتخاذ أي قرار تداول.
المستويات الرئيسية
🟢 الدعم: 63,700$ – 64,000$
🔴 المقاومة: 64,800$ – 65,800$
التحيز في السوق: صعودي قصير الأجل (طالما أن BTC يبقى فوق الدعم الرئيسي)
⚠️ هذا تحليل فني بناءً على الرسم البياني الحالي وليس نصيحة مالية. دائمًا أدر مخاطرِك وقم بإجراء بحثك الخاص (DYOR).
#Bitcoin #BTC #Crypto #BinanceSquare #cryptotrading #TechnicalAnalysis #marketanalysis. #dyor
يشير البيتكوين إلى علامات تعافٍ بعد العثور على دعم قرب منطقة 63,700$–64,000$. كما يظهر في الرسم البياني، تدخل المشترون ودفَعوا السعر مجددًا فوق المتوسط المتحرك قصير الأجل، ما يوحي بأن الزخم الصعودي قد يعود.
قد يشجع استمرار الحركة فوق 64,000$ المشترين على استهداف منطقة المقاومة 64,800$–65,800$. إذا واصل حجم التداول الزيادة، فسيعزز ذلك فرص استمرار الاتجاه الصاعد.
ومع ذلك، يجب على المتداولين توخي الحذر. إذا فشل BTC في الحفاظ على مستوى 64,000$، فقد يعود ضغط البيع ويدفع السعر للعودة نحو منطقة الدعم الأخيرة. مراقبة حجم التداول وحركة السعر حول هذه المستويات أمر ضروري قبل اتخاذ أي قرار تداول.
المستويات الرئيسية
🟢 الدعم: 63,700$ – 64,000$
🔴 المقاومة: 64,800$ – 65,800$
التحيز في السوق: صعودي قصير الأجل (طالما أن BTC يبقى فوق الدعم الرئيسي)
⚠️ هذا تحليل فني بناءً على الرسم البياني الحالي وليس نصيحة مالية. دائمًا أدر مخاطرِك وقم بإجراء بحثك الخاص (DYOR).
#Bitcoin #BTC #Crypto #BinanceSquare #cryptotrading #TechnicalAnalysis #marketanalysis. #dyor