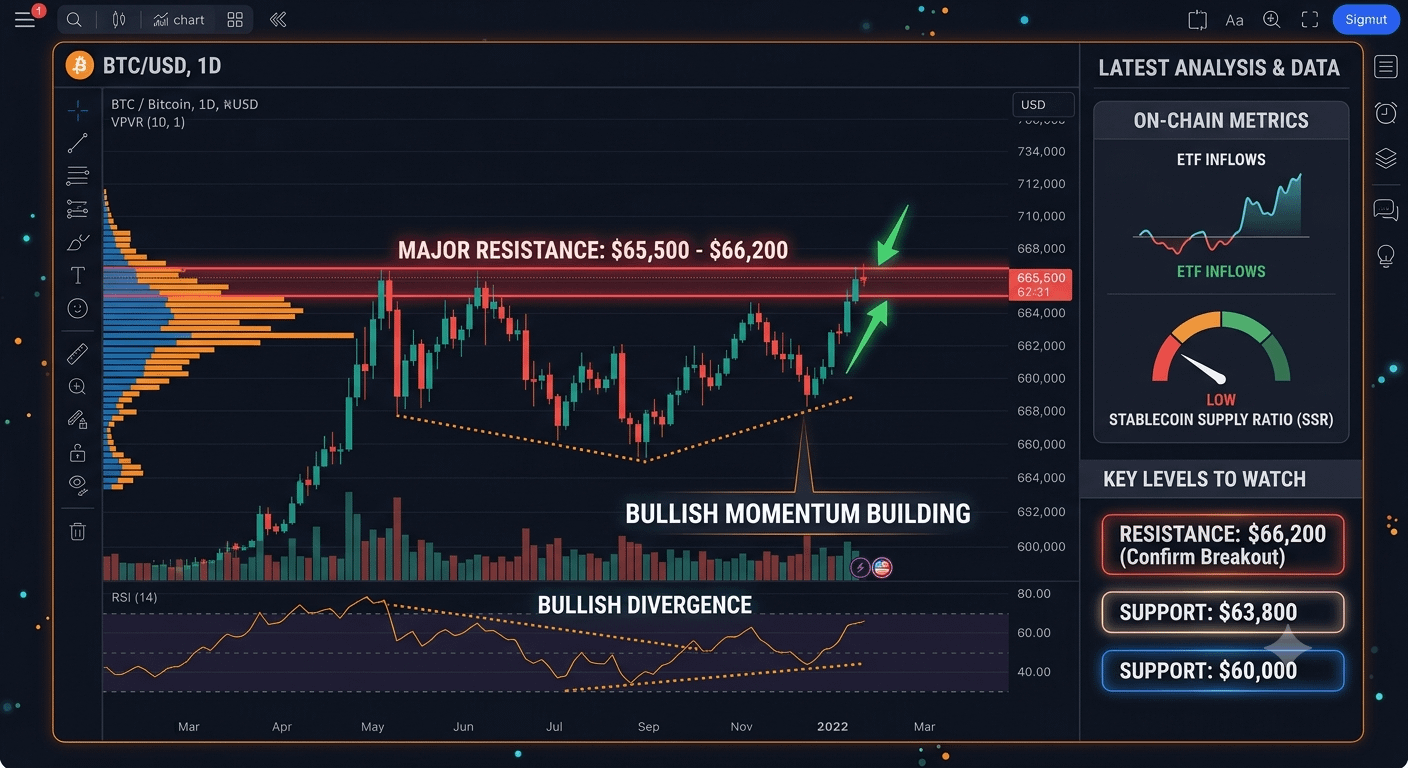
Bitcoin ($BTC ) is currently trading around $65,500, attempting a critical breakout after weeks of consolidation and volatility. The latest technical and on-chain analysis reveals a complex picture with potential for significant bullish movement, tempered by strong immediate resistance.
Technical Picture:
Looking at the daily $BTC /$USD1 chart (see the attached image), the price is testing a pivotal overhead resistance zone located between $65,500 and $66,200. This area marks the boundary between the current corrective phase and a potential resumption of the major uptrend.
Crucially, the 4-hour chart displays a notable Bullish Divergence between the price (making lower lows) and the Relative Strength Index (RSI), which is making higher lows. This often signals a reversal in momentum and suggests the recent selling pressure is dissipating.
However, the major moving averages (50-day and 200-day EMA) are still pointing sideways, indicating that a decisive breakout above $66,200 is required to confirm a shift back to a strongly bullish regime.
On-Chain Factors:
On-chain metrics provide mixed signals but a general undercurrent of long-term optimism:
ETF Inflows: Following several days of significant net outflows, Bitcoin Spot ETFs in the US have seen a return to positive net inflows. This renewed institutional interest is a strong supporting factor for the price floor.
Stablecoin Supply Ratio (SSR): This ratio is near historic lows, suggesting a vast amount of "dry powder" (stablecoins) is ready on exchanges to move into BTC, providing massive buying power if confidence returns.
Miner Selling Slowing: After a post-halving period of heavy distribution, on-chain data suggests miner selling pressure is decreasing, which reduces automatic selling pressure on the market.
Conclusion & Key Levels:
Bitcoin is at a crossroads. The technical bullish divergence and supportive on-chain metrics point to the potential for a rally. However, the overhead resistance is formidable.
Key Resistance: A decisive breakout and daily close above $66,200 would clear the immediate hurdles and likely spark a rally towards $70,000 and the all-time high.
Key Support: The immediate support sits at $63,800, which must hold to maintain the possibility of a breakout. A drop below this level could lead to a retest of the psychological $60,000 support
.The market remains finely balanced, with the upcoming economic data releases and the path of the US Dollar (DXY) likely to act as major catalysts.