Chart Technical Breakdown
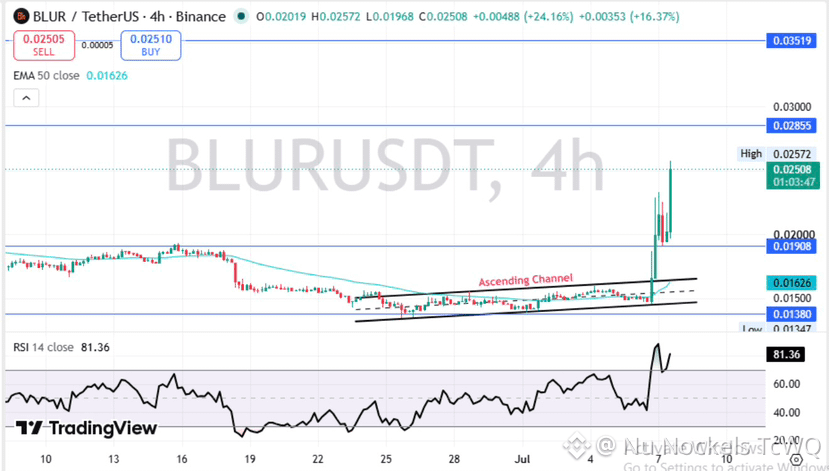
If you look at the chart above, you can see exactly why this move caught short-sellers completely off guard:
The Ascending Channel Breakout: For the past several days, $BLUR was locked in a tight, slow-moving ascending consolidation channel between $0.0138 and $0.0165. This slow crawl made it look like a prime target for short-sellers to load up on leverage.
The Squeeze Candle: Notice the massive, vertical green candle on the right side of the chart. The moment $BLUR cracked the $0.0165 upper resistance band, it triggered an immediate cascading failure of short positions. The forced liquidations acted like jet fuel, blowing the price straight up past the psychological $0.020 barrier to a local high of $0.0257 before finding brief resistance.
RSI Extremes: The Relative Strength Index (RSI 14) at the bottom of the chart shows just how aggressive this momentum is. It has slammed all the way up to 81.36, placing it deep in the "overbought" territory. In high-leverage short squeezes, indicators can stay overbought longer than expected, but it signals that the initial, easy-entry momentum has reached a highly speculative phase.
Moving Average Support: The 50-period Exponential Moving Average (EMA 50, the blue line) is left completely trailing behind down at $0.01626, showcasing just how detached this short-term pump is from its multi-day baseline.
$BLUR
#BLUR #BinanceTurns9 #BitcoinFailsToHold$64.4K #TreasuryCommerceVieForBitcoinReserveControl #HongKongCompletesFirstGoldTradeSettlement
If you look at the chart above, you can see exactly why this move caught short-sellers completely off guard:
The Ascending Channel Breakout: For the past several days, $BLUR was locked in a tight, slow-moving ascending consolidation channel between $0.0138 and $0.0165. This slow crawl made it look like a prime target for short-sellers to load up on leverage.
The Squeeze Candle: Notice the massive, vertical green candle on the right side of the chart. The moment $BLUR cracked the $0.0165 upper resistance band, it triggered an immediate cascading failure of short positions. The forced liquidations acted like jet fuel, blowing the price straight up past the psychological $0.020 barrier to a local high of $0.0257 before finding brief resistance.
RSI Extremes: The Relative Strength Index (RSI 14) at the bottom of the chart shows just how aggressive this momentum is. It has slammed all the way up to 81.36, placing it deep in the "overbought" territory. In high-leverage short squeezes, indicators can stay overbought longer than expected, but it signals that the initial, easy-entry momentum has reached a highly speculative phase.
Moving Average Support: The 50-period Exponential Moving Average (EMA 50, the blue line) is left completely trailing behind down at $0.01626, showcasing just how detached this short-term pump is from its multi-day baseline.
$BLUR
#BLUR #BinanceTurns9 #BitcoinFailsToHold$64.4K #TreasuryCommerceVieForBitcoinReserveControl #HongKongCompletesFirstGoldTradeSettlement