
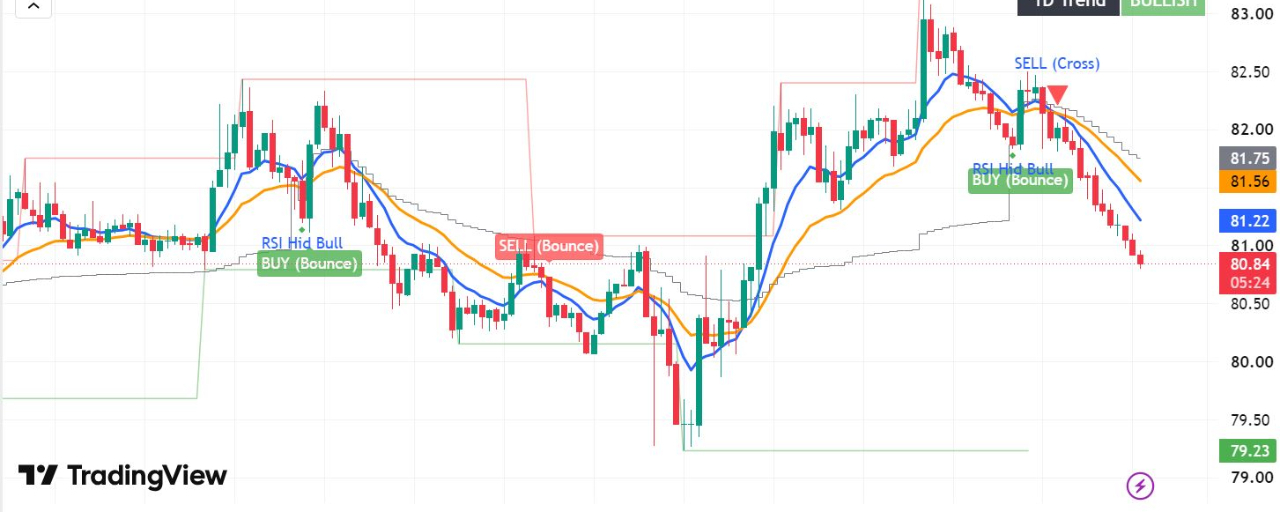
Solana ($SOL) has been put under severe testing this week. After an impressive 14% rally last week, the bulls faced immediate rejection right at the 100-day Exponential Moving Average (EMA) near the $81.60 - $81.65 resistance level.
Currently, we are seeing a minor pullback as leveraged positions get flushed out, but the underlying metrics tell a much bigger story.
🔍 Technical & On-Chain Breakdown:
The Resistance: The 100-day EMA at $81.63 is acting as a major supply wall. We need a daily candle close above $82 to confirm a massive continuation breakout.
Institutional Demand: Despite the price pause, US-listed spot SOL ETFs recorded an inflow of $5.75 million last week. Big money is quietly accumulating on the dips.
Liquidation Heatmap: Derivatives positioning shows heavy liquidity clusters building up around lower support regions. If the market takes out short-term longs, a quick wick down to the $76 - $78 support zone will serve as an ideal re-entry area for scalp setups.
🎯 My Trading Strategy:
Bulls are still fundamentally in control as long-term on-chain activity remains highly active. I am personally hunting for long setups inside the $76–$78 zone, targeting a breakout back toward $85+ once momentum shifts.
💵 Ready to Trade this Setup? Get Maximum Discount on Fees!
If you want to scalp or swing trade this SOL setup with tight spreads and deep liquidity, use my official Binance link below to set up your account.
By using this exclusive link, you will receive a permanent discount on your trading fees (which saves a lot of money if you are trading futures or high volume):
👉 Get Your Trading Fee Discount Here
Disclaimer: Crypto trading involves high risk, especially in derivatives. Use proper risk management and never risk more than you can afford to lose.
#Solana #SOL #CryptoTrading #TechnicalAnalysis #Binance